
Sintered NdFeB Demagnetization Curves (Measured, N35–N56, M, H, SH, UH, EH)
Every 20 °C curve on this page comes from a hysteresisgraph test report of an AIC sintered NdFeB production lot, measured on a Ø8–10 mm cylinder sample at 20 °C. For legibility each chart is redrawn from the report: the J-H curve is traced point by point from the original plot, B-H and B×H are derived from it, and every number in the results box is copied from the report's own Measurement Results panel. The original scan (tester names, report numbers and letterheads blanked out) is linked under each chart. The variable-temperature charts further down are shown as the original scans.
The values are single-lot test results, not guaranteed minimums. The grade table on the product page lists typical values; specification limits for an order are agreed per order, and we can supply the test report of the actual lot. Some grades measured here (e.g. N56, 54H, 52SH, 52UH, 45EH, cerium and T grades) are not in that standard table — ask us about them.
How to read the curves
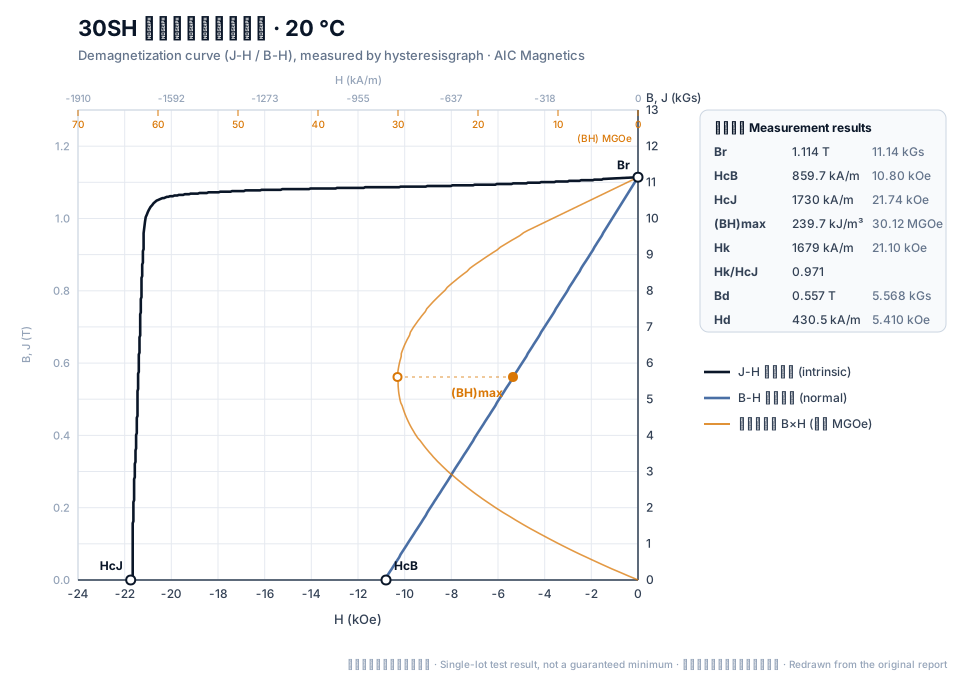
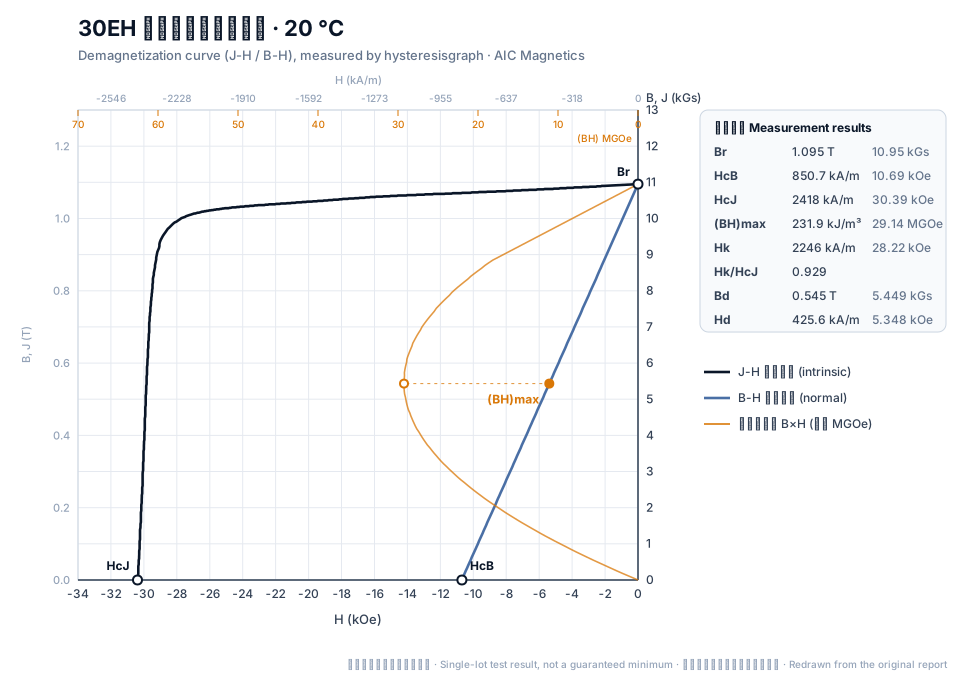
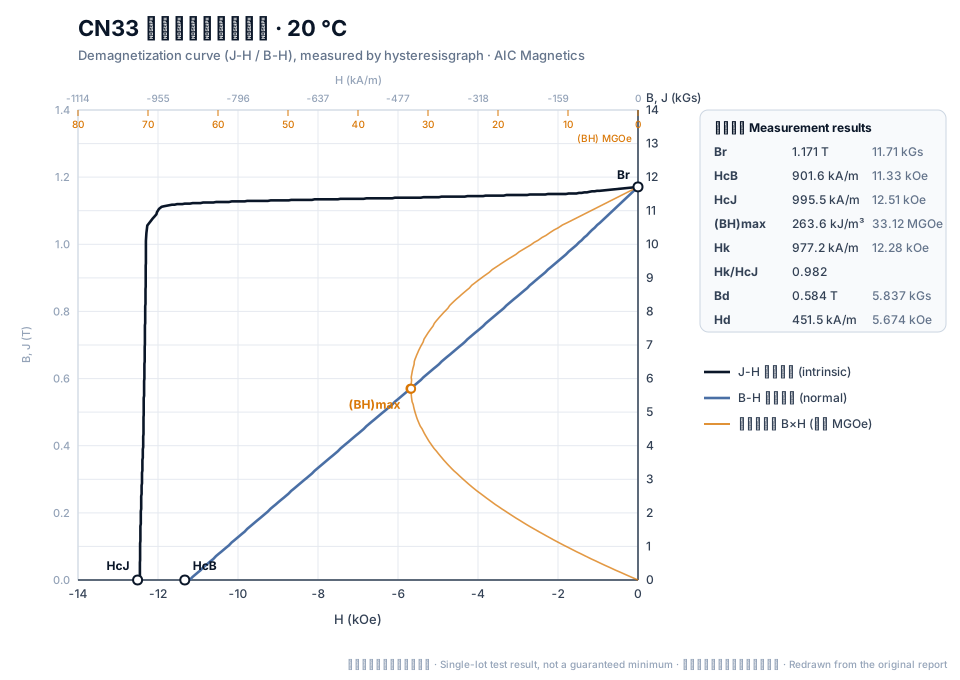
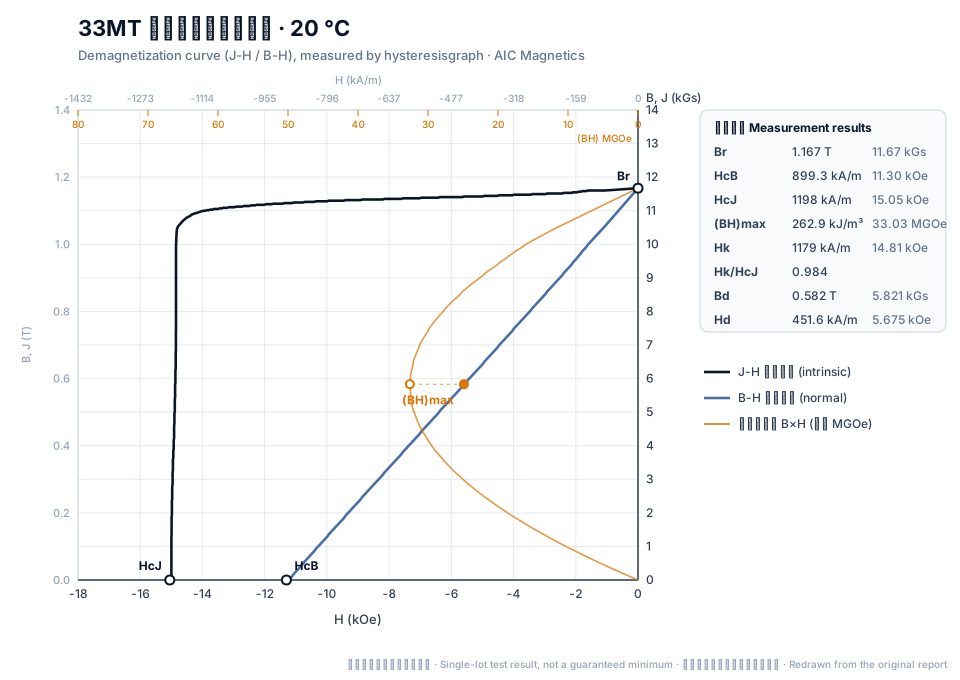
- Upper flat line ending in a vertical drop — the intrinsic J-H curve. Where it crosses the H axis is HcJ: the higher it is, the more heat and reverse field the magnet survives.
- Straight-then-bending line — the normal B-H curve. Its value at H = 0 is Br (remanence); where it reaches the H axis is HcB.
- Parabola, read on the middle (MGOe) scale — the energy product B×H. Its peak is (BH)max.
- Hk/HcJ (squareness) — how square the J-H knee is. Hk is the field at which J has fallen to 90 % of Br; the closer Hk/HcJ is to 1, the steeper the knee.
All measured grades at 20 °C
Click a grade button to see its curve. Rated max working temperature is the series rating at a high permeance coefficient (Pc ≥ 2); thin parts run cooler.
| Grade | Br (T) | HcJ (kA/m / kOe) | (BH)max (kJ/m³ / MGOe) | Hk/HcJ | Max temp. |
|---|---|---|---|---|---|
| N35 | 1.189 | 1033 / 12.97 | 275 / 34.56 | 0.970 | ≤ 80 °C |
| N40 | 1.267 | 1040 / 13.07 | 312.4 / 39.25 | 0.984 | ≤ 80 °C |
| N42 | 1.307 | 1025 / 12.88 | 319.4 / 40.14 | 0.960 | ≤ 80 °C |
| N45 | 1.365 | 1047 / 13.15 | 361.7 / 45.45 | 0.990 | ≤ 80 °C |
| N48 | 1.384 | 1012 / 12.72 | 364.6 / 45.82 | 0.987 | ≤ 80 °C |
| N50 | 1.403 | 1099 / 13.8 | 377.4 / 47.42 | 0.979 | ≤ 80 °C |
| N52 | 1.451 | 1111 / 13.96 | 390.6 / 49.08 | 0.988 | ≤ 80 °C |
| N56 | 1.485 | 1034 / 12.99 | 423.1 / 53.17 | 0.979 | ≤ 80 °C |
| 35M | 1.207 | 1177 / 14.79 | 279.7 / 35.15 | 0.987 | ≤ 100 °C |
| 38M | 1.249 | 1170 / 14.7 | 297.4 / 37.37 | 0.978 | ≤ 100 °C |
| 42M | 1.308 | 1116 / 14.02 | 332.7 / 41.81 | 1.001 | ≤ 100 °C |
| 45M | 1.350 | 1183 / 14.87 | 345.7 / 43.44 | 0.985 | ≤ 100 °C |
| 48M | 1.387 | 1171 / 14.71 | 367.9 / 46.23 | 0.983 | ≤ 100 °C |
| 50M | 1.402 | 1171 / 14.71 | 374.5 / 47.06 | 0.984 | ≤ 100 °C |
| 52M | 1.435 | 1208 / 15.18 | 393.3 / 49.42 | 0.980 | ≤ 100 °C |
| 54M | 1.469 | 1153 / 14.49 | 406.9 / 51.13 | 0.967 | ≤ 100 °C |
| 33H | 1.153 | 1385 / 17.41 | 254.2 / 31.95 | 0.977 | ≤ 120 °C |
| 35H | 1.207 | 1472 / 18.5 | 282 / 35.44 | 0.972 | ≤ 120 °C |
| 40H | 1.269 | 1345 / 16.9 | 313.5 / 39.4 | 0.946 | ≤ 120 °C |
| 42H | 1.303 | 1419 / 17.83 | 325.9 / 40.95 | 0.990 | ≤ 120 °C |
| 45H | 1.344 | 1421 / 17.85 | 345.9 / 43.47 | 0.988 | ≤ 120 °C |
| 48H | 1.377 | 1436 / 18.04 | 367.9 / 46.23 | 0.971 | ≤ 120 °C |
| 50H | 1.423 | 1473 / 18.51 | 387.2 / 48.65 | 0.988 | ≤ 120 °C |
| 52H | 1.429 | 1475 / 18.53 | 393.3 / 49.42 | 0.985 | ≤ 120 °C |
| 54H | 1.451 | 1387 / 17.43 | 406.6 / 51.09 | 0.989 | ≤ 120 °C |
| 30SH | 1.114 | 1730 / 21.74 | 239.7 / 30.12 | 0.971 | ≤ 150 °C |
| 33SH | 1.165 | 1658 / 20.83 | 255 / 32.05 | 0.957 | ≤ 150 °C |
| 35SH | 1.214 | 1612 / 20.26 | 282.8 / 35.54 | 0.984 | ≤ 150 °C |
| 38SH | 1.251 | 1628 / 20.46 | 300 / 37.7 | 0.988 | ≤ 150 °C |
| 40SH | 1.278 | 1650 / 20.73 | 313.1 / 39.35 | 0.989 | ≤ 150 °C |
| 42SH | 1.317 | 1605 / 20.17 | 333 / 41.85 | 0.989 | ≤ 150 °C |
| 45SH | 1.337 | 1682 / 21.13 | 343.7 / 43.19 | 0.995 | ≤ 150 °C |
| 48SH | 1.371 | 1685 / 21.17 | 363.4 / 45.67 | 0.978 | ≤ 150 °C |
| 50SH | 1.410 | 1650 / 20.73 | 384.4 / 48.3 | 0.987 | ≤ 150 °C |
| 52SH | 1.423 | 1603 / 20.14 | 392.4 / 49.31 | 0.978 | ≤ 150 °C |
| 28UH | 1.042 | 2017 / 25.34 | 213.8 / 26.86 | 0.970 | ≤ 180 °C |
| 33UH | 1.163 | 2033 / 25.55 | 262.5 / 32.98 | 0.960 | ≤ 180 °C |
| 35UH | 1.192 | 2021 / 25.4 | 275.8 / 34.66 | 0.961 | ≤ 180 °C |
| 38UH | 1.251 | 2035 / 25.57 | 304.2 / 38.22 | 0.969 | ≤ 180 °C |
| 40UH | 1.272 | 2014 / 25.31 | 316 / 39.71 | 0.976 | ≤ 180 °C |
| 42UH | 1.298 | 2018 / 25.36 | 327.4 / 41.14 | 0.978 | ≤ 180 °C |
| 45UH | 1.339 | 2009 / 25.25 | 347.2 / 43.63 | 0.964 | ≤ 180 °C |
| 48UH | 1.395 | 2020 / 25.38 | 373.2 / 46.9 | 0.966 | ≤ 180 °C |
| 50UH | 1.400 | 2008 / 25.23 | 382.1 / 48.01 | 0.952 | ≤ 180 °C |
| 52UH | 1.430 | 2028 / 25.48 | 391.9 / 49.24 | 0.965 | ≤ 180 °C |
| 30EH | 1.095 | 2418 / 30.39 | 231.9 / 29.14 | 0.929 | ≤ 200 °C |
| 33EH | 1.150 | 2436 / 30.61 | 255.2 / 32.07 | 0.928 | ≤ 200 °C |
| 35EH | 1.200 | 2413 / 30.32 | 278 / 34.93 | 0.926 | ≤ 200 °C |
| 45EH | 1.340 | 2422 / 30.43 | 343.3 / 43.14 | 0.926 | ≤ 200 °C |
| CN33Ce | 1.171 | 995.5 / 12.51 | 263.6 / 33.12 | 0.982 | ≤ 80 °C |
| CN52Ce | 1.433 | 1004 / 12.62 | 391.2 / 49.16 | 0.986 | ≤ 80 °C |
| CN54Ce | 1.458 | 961.3 / 12.08 | 406.4 / 51.07 | 0.967 | ≤ 80 °C |
| C35MCe | 1.237 | 1124 / 14.12 | 281.8 / 35.41 | 0.977 | ≤ 100 °C |
| C45MCe | 1.344 | 1162 / 14.6 | 344.3 / 43.27 | 0.962 | ≤ 100 °C |
| 33MTT | 1.167 | 1198 / 15.05 | 262.9 / 33.03 | 0.984 | ≤ 100 °C |
| 38HTT | 1.263 | 1531 / 19.24 | 307.8 / 38.68 | 0.987 | ≤ 120 °C |
| 42HTT | 1.309 | 1562 / 19.63 | 332.3 / 41.76 | 0.983 | ≤ 120 °C |
| 45HTT | 1.354 | 1517 / 19.07 | 354.6 / 44.55 | 0.978 | ≤ 120 °C |
| 48HTT | 1.421 | 1435 / 18.03 | 385.3 / 48.42 | 0.988 | ≤ 120 °C |
| 50HTT | 1.404 | 1519 / 19.09 | 382.1 / 48.02 | 0.980 | ≤ 120 °C |
| 52HTT | 1.426 | 1514 / 19.03 | 391.1 / 49.15 | 0.980 | ≤ 120 °C |
| 35SHTT | 1.193 | 1829 / 22.98 | 275.4 / 34.61 | 0.976 | ≤ 150 °C |
| 38SHTT | 1.244 | 1784 / 22.42 | 294.5 / 37.01 | 0.969 | ≤ 150 °C |
| 48SHTT | 1.388 | 1818 / 22.84 | 372.6 / 46.82 | 0.987 | ≤ 150 °C |
N series — standard coercivity (≤ 80 °C)
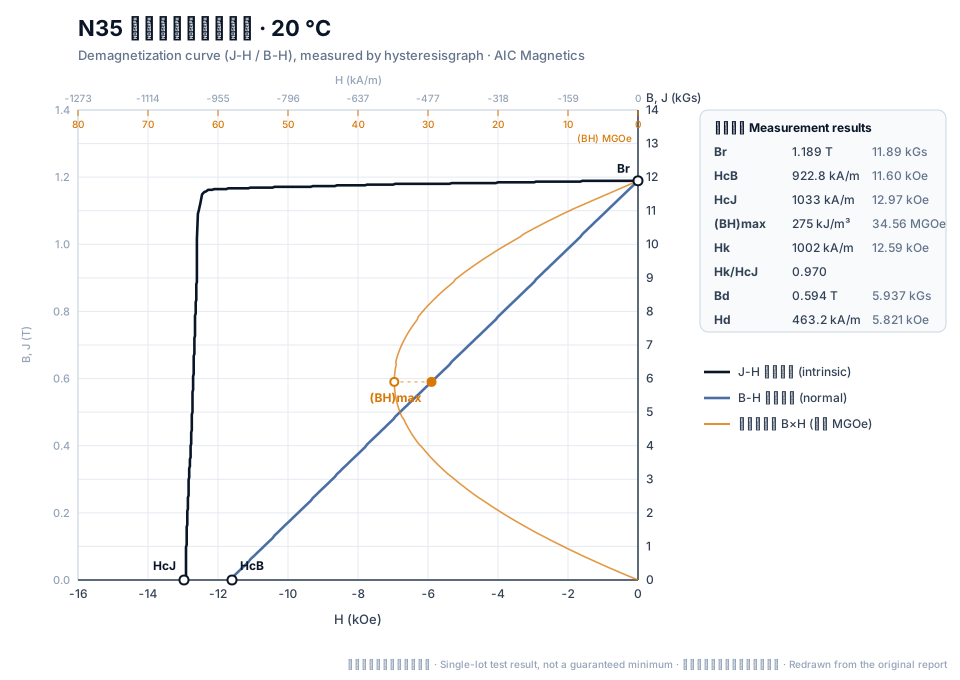
N35
N35 measured at 20 °C: Br 1.189 T (11.89 kGs), HcJ 1033 kA/m (12.97 kOe), (BH)max 275 kJ/m³ (34.56 MGOe), Hk/HcJ 0.970.
View the original test report (scan) →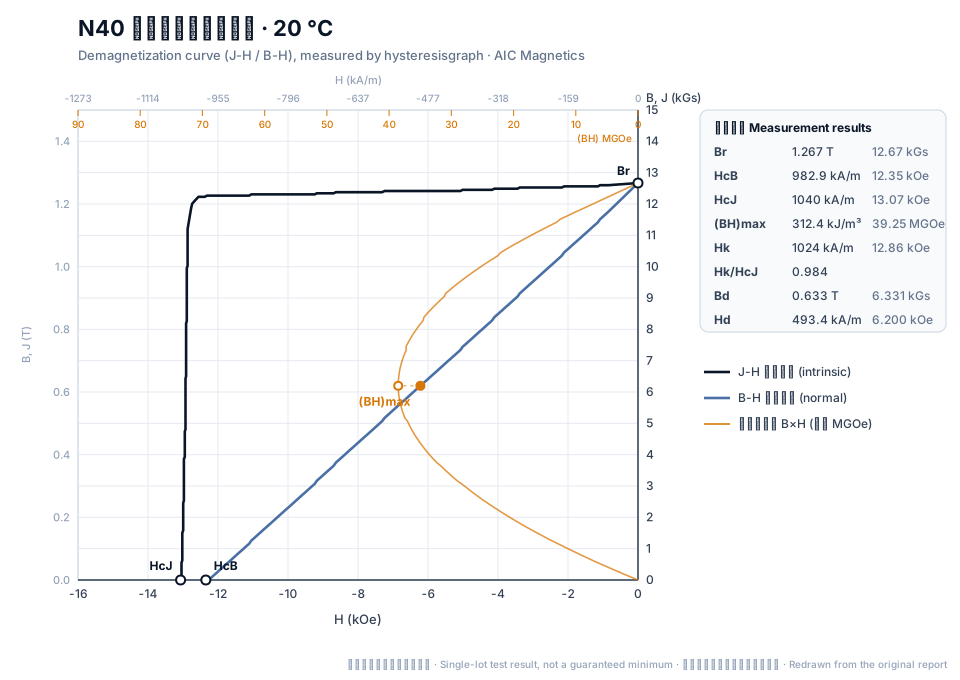
N40
N40 measured at 20 °C: Br 1.267 T (12.67 kGs), HcJ 1040 kA/m (13.07 kOe), (BH)max 312.4 kJ/m³ (39.25 MGOe), Hk/HcJ 0.984.
View the original test report (scan) →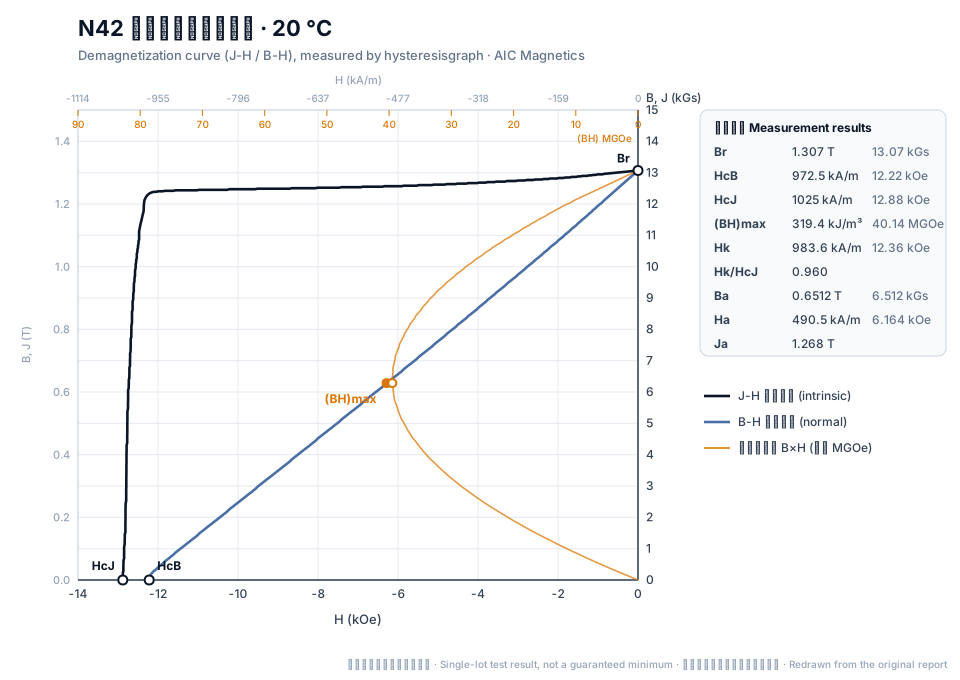
N42
N42 measured at 20 °C: Br 1.307 T (13.07 kGs), HcJ 1025 kA/m (12.88 kOe), (BH)max 319.4 kJ/m³ (40.14 MGOe), Hk/HcJ 0.960.
View the original test report (scan) →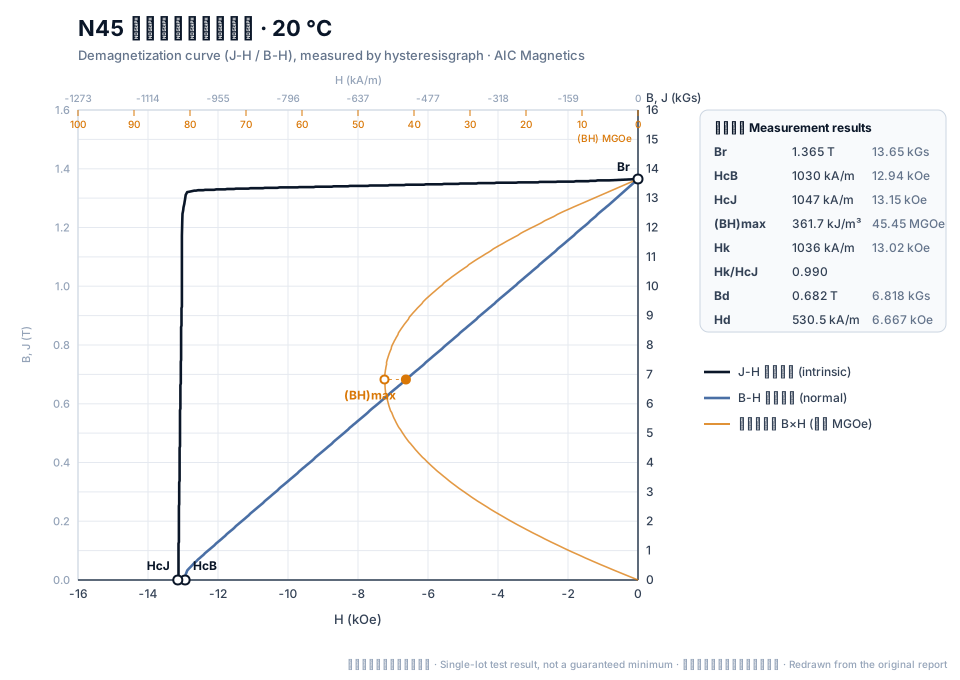
N45
N45 measured at 20 °C: Br 1.365 T (13.65 kGs), HcJ 1047 kA/m (13.15 kOe), (BH)max 361.7 kJ/m³ (45.45 MGOe), Hk/HcJ 0.990.
View the original test report (scan) →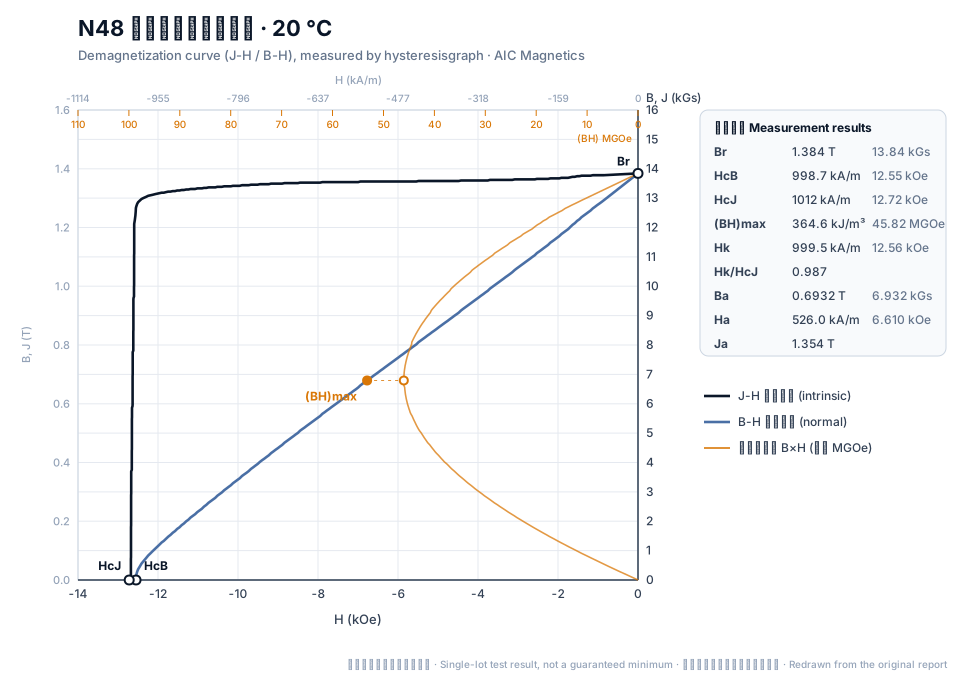
N48
N48 measured at 20 °C: Br 1.384 T (13.84 kGs), HcJ 1012 kA/m (12.72 kOe), (BH)max 364.6 kJ/m³ (45.82 MGOe), Hk/HcJ 0.987.
View the original test report (scan) →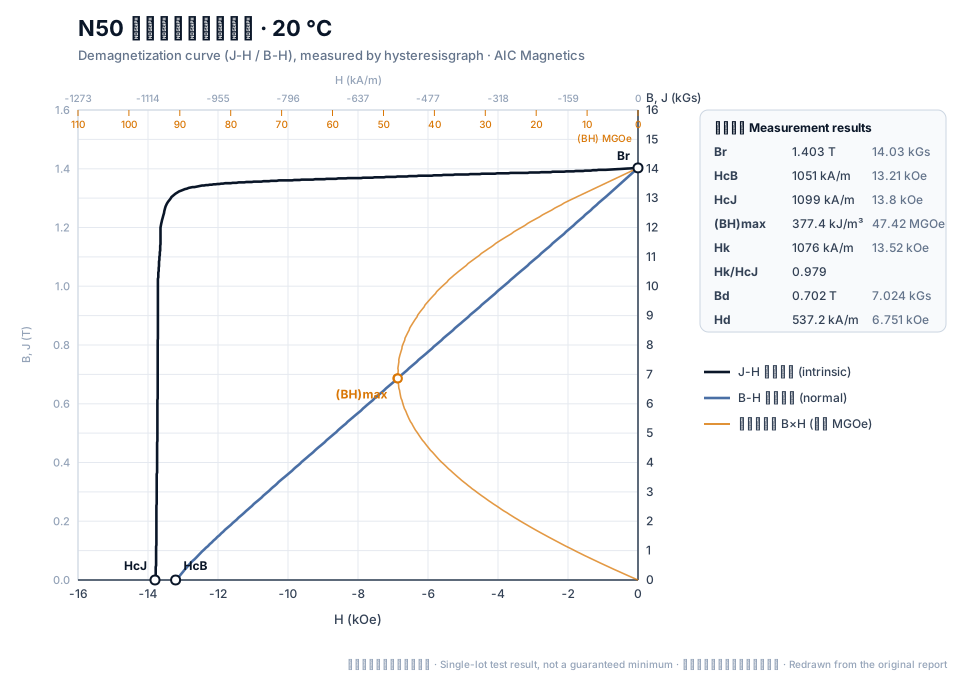
N50
N50 measured at 20 °C: Br 1.403 T (14.03 kGs), HcJ 1099 kA/m (13.8 kOe), (BH)max 377.4 kJ/m³ (47.42 MGOe), Hk/HcJ 0.979.
View the original test report (scan) →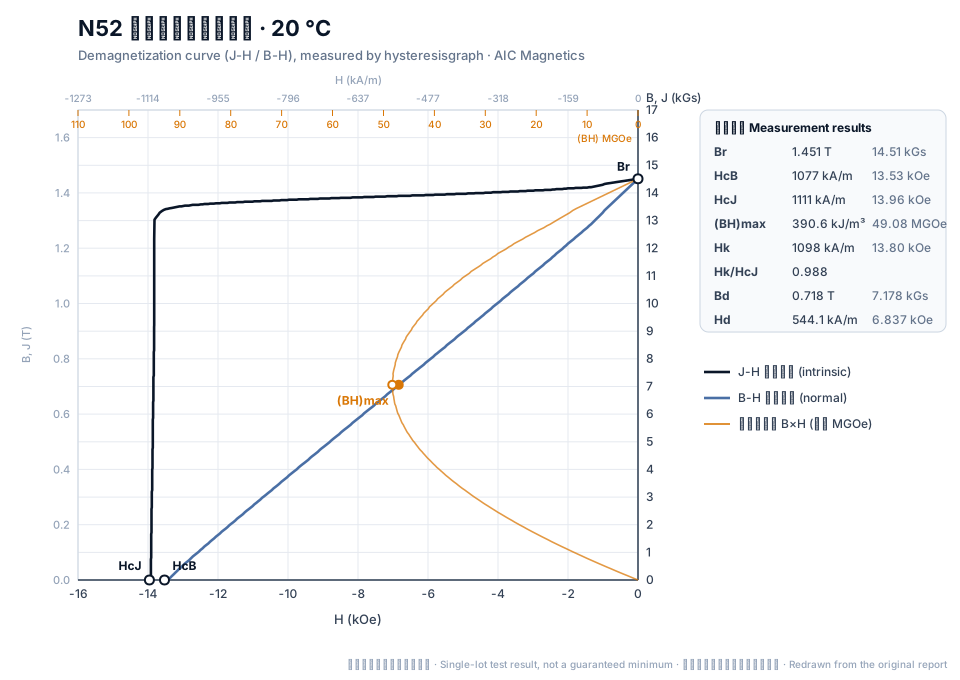
N52
N52 measured at 20 °C: Br 1.451 T (14.51 kGs), HcJ 1111 kA/m (13.96 kOe), (BH)max 390.6 kJ/m³ (49.08 MGOe), Hk/HcJ 0.988.
View the original test report (scan) →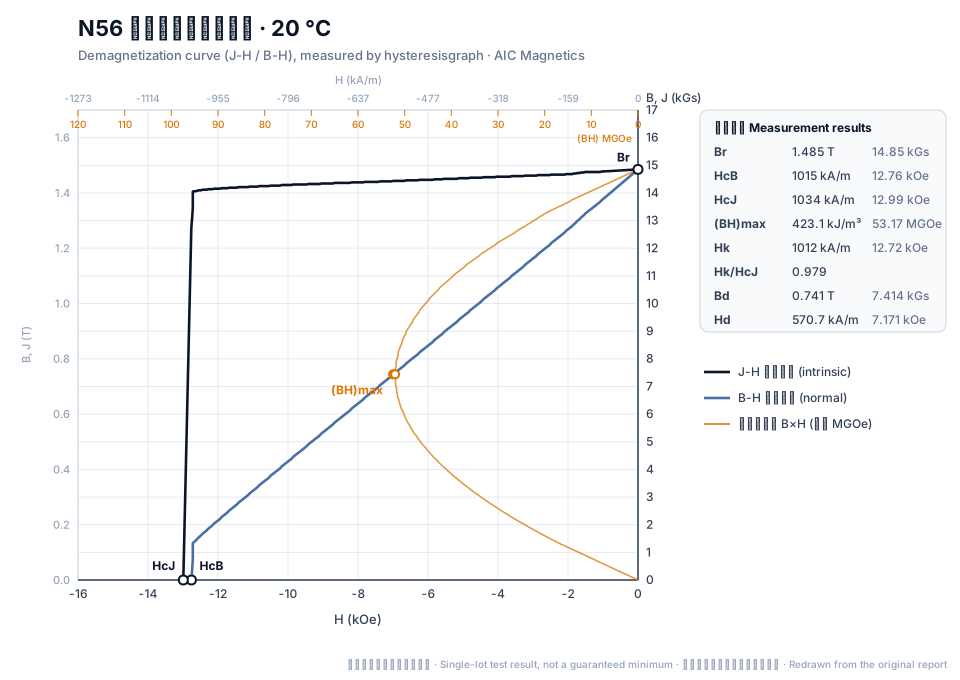
N56
N56 measured at 20 °C: Br 1.485 T (14.85 kGs), HcJ 1034 kA/m (12.99 kOe), (BH)max 423.1 kJ/m³ (53.17 MGOe), Hk/HcJ 0.979.
View the original test report (scan) →M series — medium coercivity (≤ 100 °C)
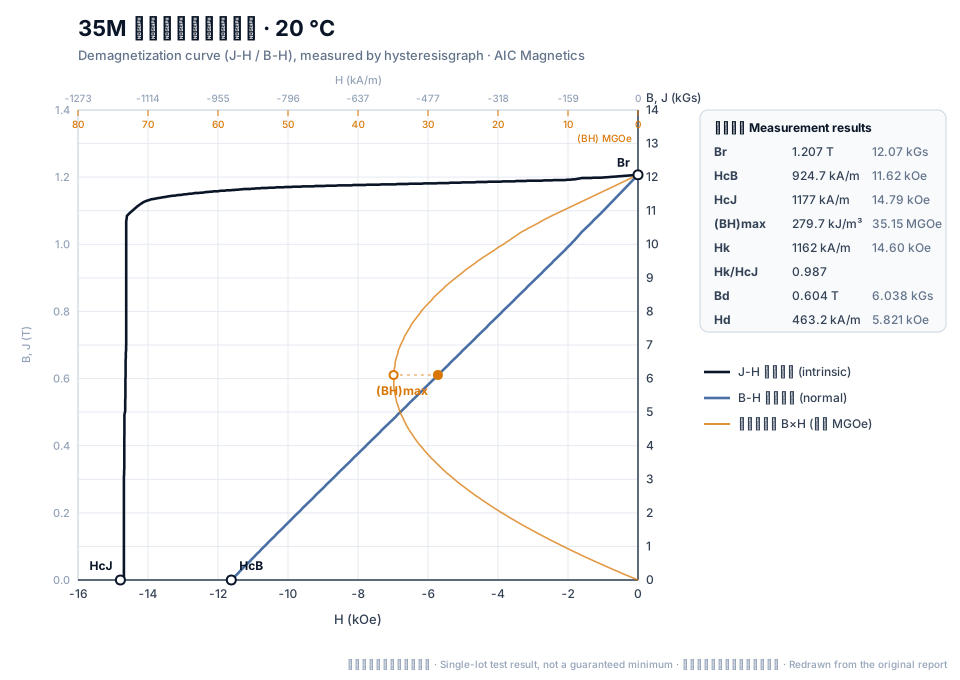
35M
35M measured at 20 °C: Br 1.207 T (12.07 kGs), HcJ 1177 kA/m (14.79 kOe), (BH)max 279.7 kJ/m³ (35.15 MGOe), Hk/HcJ 0.987.
View the original test report (scan) →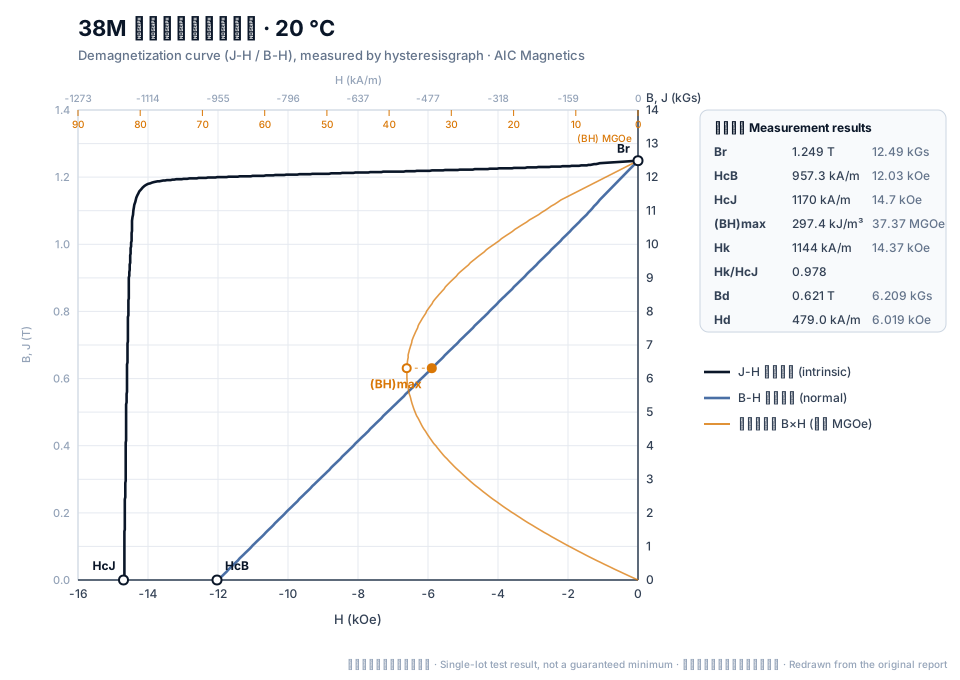
38M
38M measured at 20 °C: Br 1.249 T (12.49 kGs), HcJ 1170 kA/m (14.7 kOe), (BH)max 297.4 kJ/m³ (37.37 MGOe), Hk/HcJ 0.978.
View the original test report (scan) →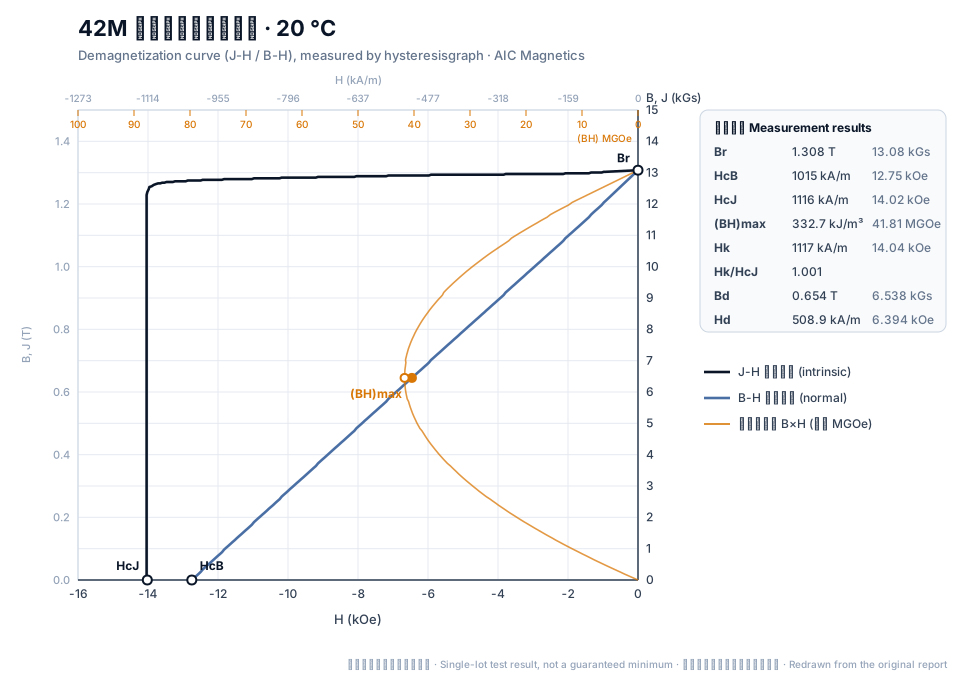
42M
42M measured at 20 °C: Br 1.308 T (13.08 kGs), HcJ 1116 kA/m (14.02 kOe), (BH)max 332.7 kJ/m³ (41.81 MGOe), Hk/HcJ 1.001.
View the original test report (scan) →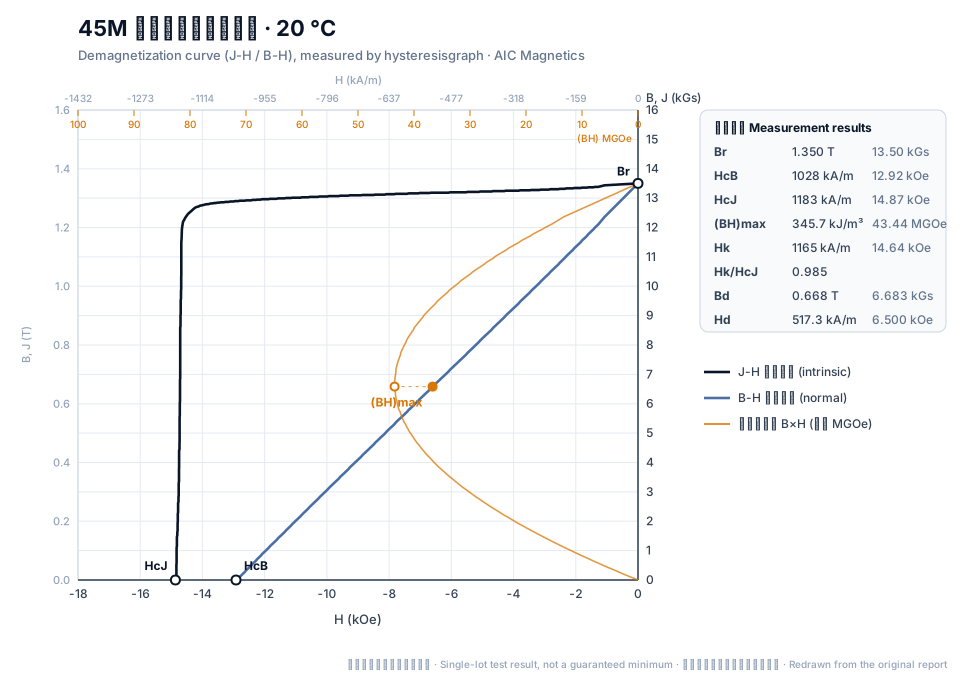
45M
45M measured at 20 °C: Br 1.350 T (13.50 kGs), HcJ 1183 kA/m (14.87 kOe), (BH)max 345.7 kJ/m³ (43.44 MGOe), Hk/HcJ 0.985.
View the original test report (scan) →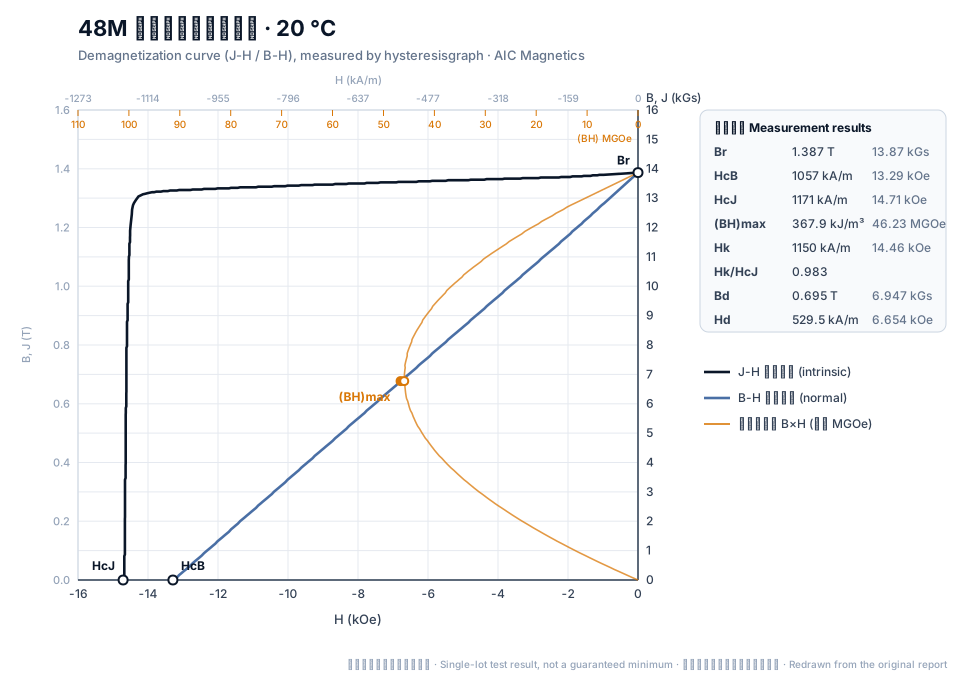
48M
48M measured at 20 °C: Br 1.387 T (13.87 kGs), HcJ 1171 kA/m (14.71 kOe), (BH)max 367.9 kJ/m³ (46.23 MGOe), Hk/HcJ 0.983.
View the original test report (scan) →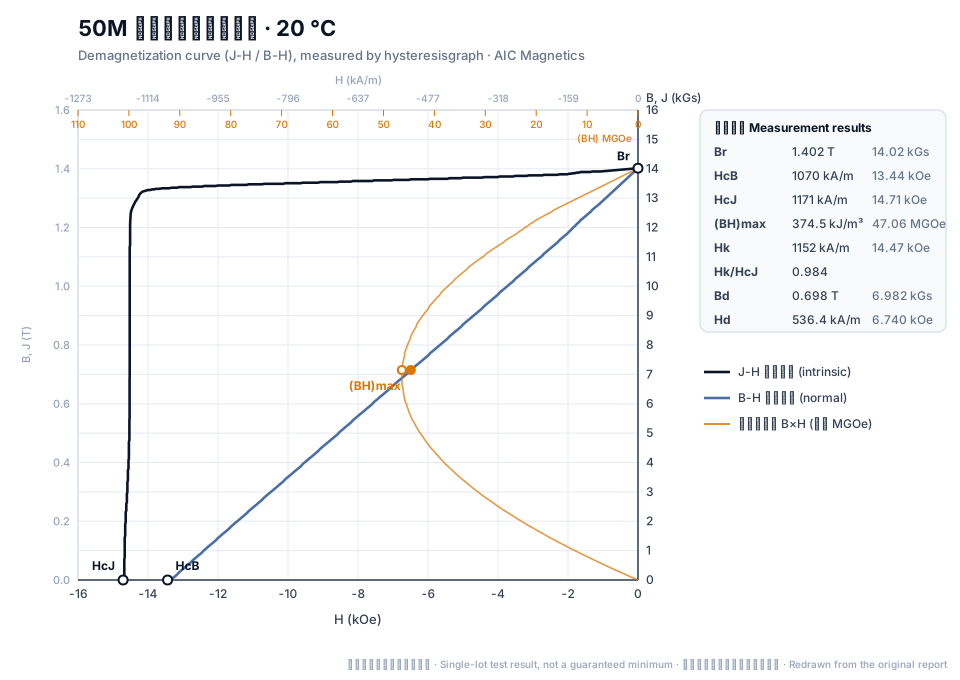
50M
50M measured at 20 °C: Br 1.402 T (14.02 kGs), HcJ 1171 kA/m (14.71 kOe), (BH)max 374.5 kJ/m³ (47.06 MGOe), Hk/HcJ 0.984.
View the original test report (scan) →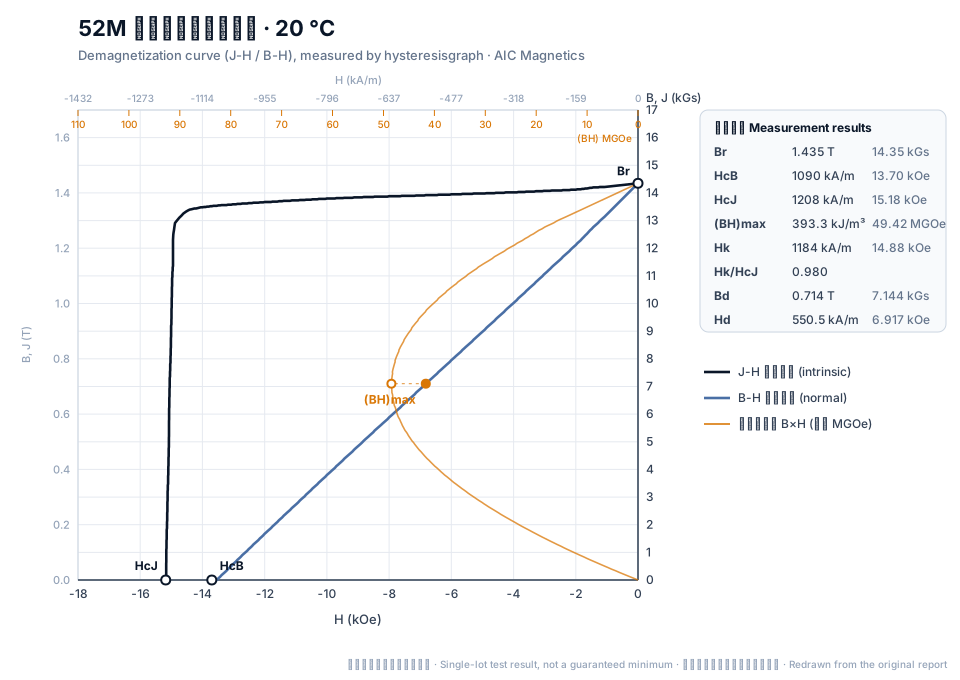
52M
52M measured at 20 °C: Br 1.435 T (14.35 kGs), HcJ 1208 kA/m (15.18 kOe), (BH)max 393.3 kJ/m³ (49.42 MGOe), Hk/HcJ 0.980.
View the original test report (scan) →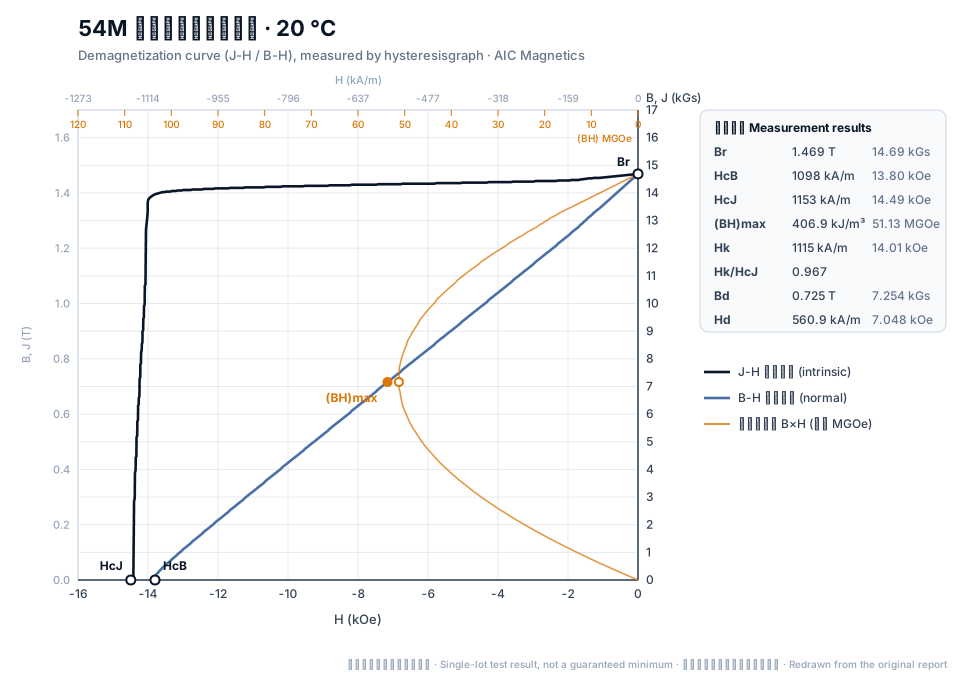
54M
54M measured at 20 °C: Br 1.469 T (14.69 kGs), HcJ 1153 kA/m (14.49 kOe), (BH)max 406.9 kJ/m³ (51.13 MGOe), Hk/HcJ 0.967.
View the original test report (scan) →H series — high coercivity (≤ 120 °C)
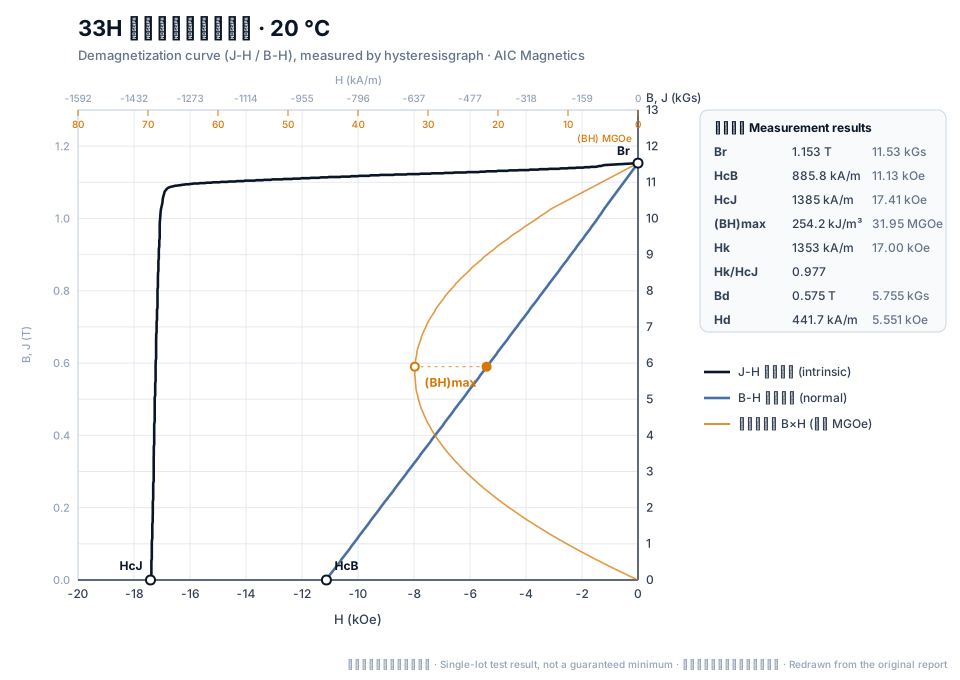
33H
33H measured at 20 °C: Br 1.153 T (11.53 kGs), HcJ 1385 kA/m (17.41 kOe), (BH)max 254.2 kJ/m³ (31.95 MGOe), Hk/HcJ 0.977.
View the original test report (scan) →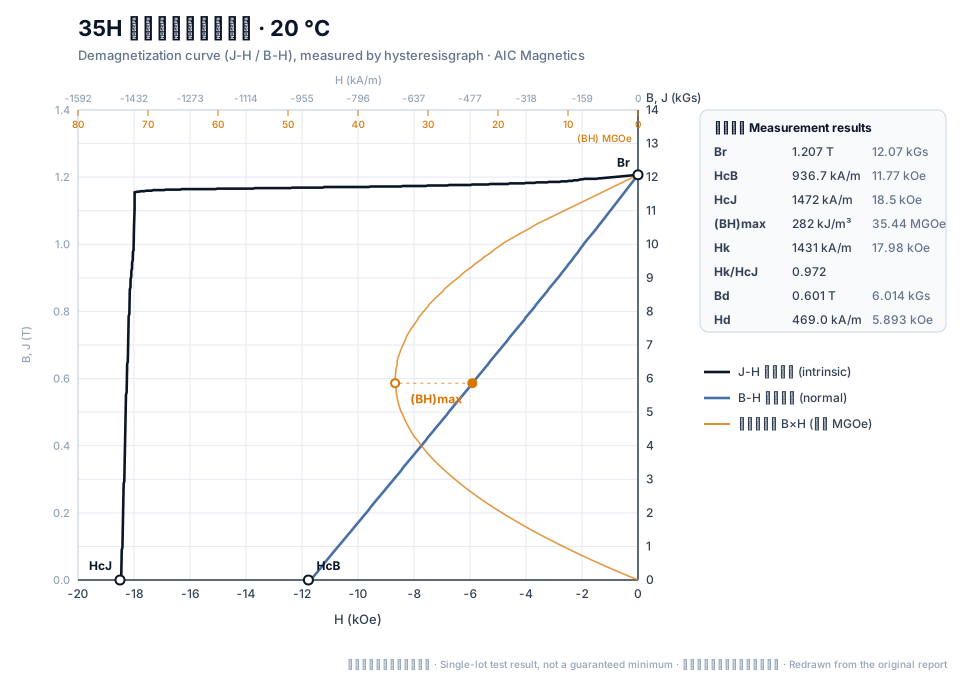
35H
35H measured at 20 °C: Br 1.207 T (12.07 kGs), HcJ 1472 kA/m (18.5 kOe), (BH)max 282 kJ/m³ (35.44 MGOe), Hk/HcJ 0.972.
View the original test report (scan) →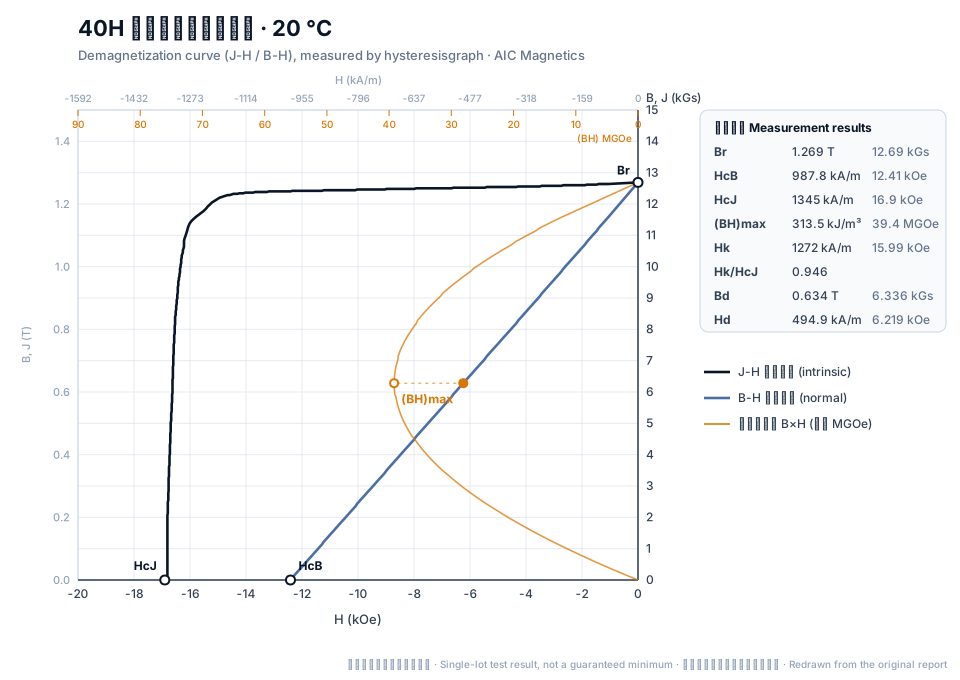
40H
40H measured at 20 °C: Br 1.269 T (12.69 kGs), HcJ 1345 kA/m (16.9 kOe), (BH)max 313.5 kJ/m³ (39.4 MGOe), Hk/HcJ 0.946.
View the original test report (scan) →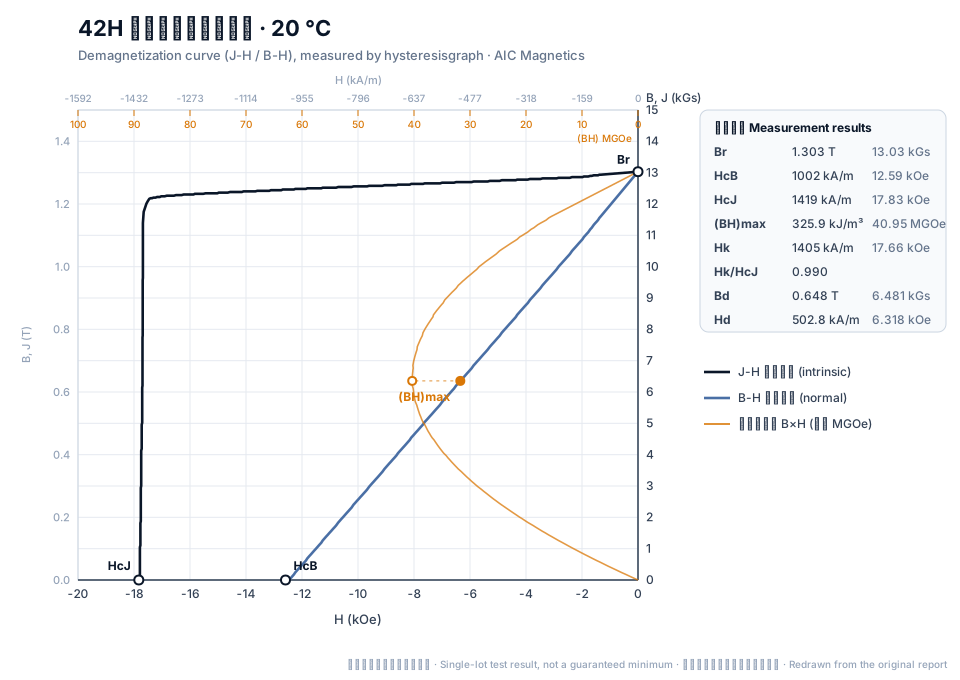
42H
42H measured at 20 °C: Br 1.303 T (13.03 kGs), HcJ 1419 kA/m (17.83 kOe), (BH)max 325.9 kJ/m³ (40.95 MGOe), Hk/HcJ 0.990.
View the original test report (scan) →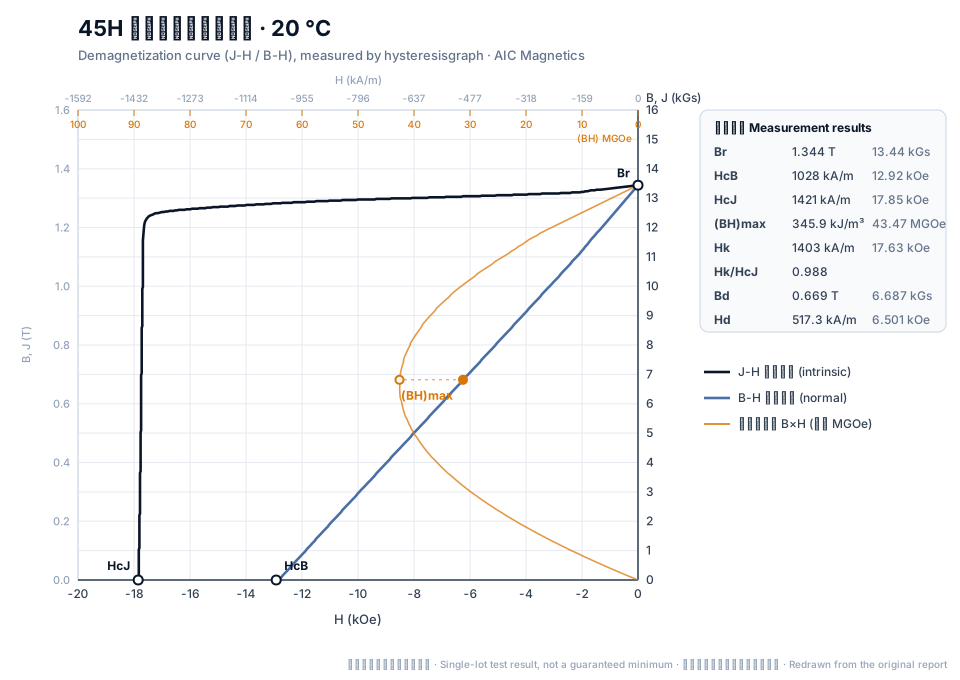
45H
45H measured at 20 °C: Br 1.344 T (13.44 kGs), HcJ 1421 kA/m (17.85 kOe), (BH)max 345.9 kJ/m³ (43.47 MGOe), Hk/HcJ 0.988.
View the original test report (scan) →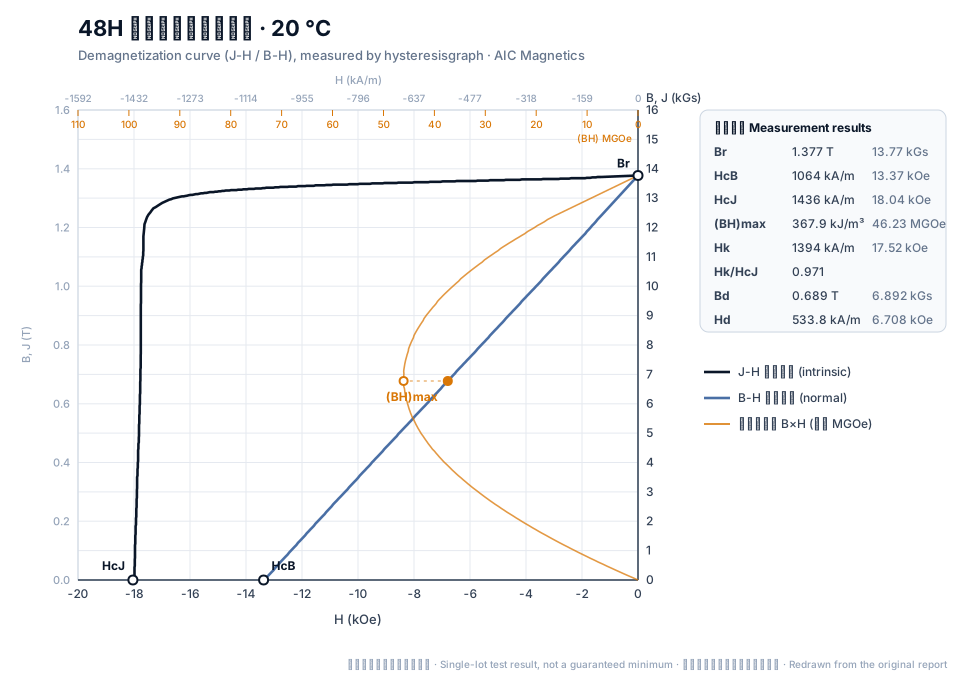
48H
48H measured at 20 °C: Br 1.377 T (13.77 kGs), HcJ 1436 kA/m (18.04 kOe), (BH)max 367.9 kJ/m³ (46.23 MGOe), Hk/HcJ 0.971.
View the original test report (scan) →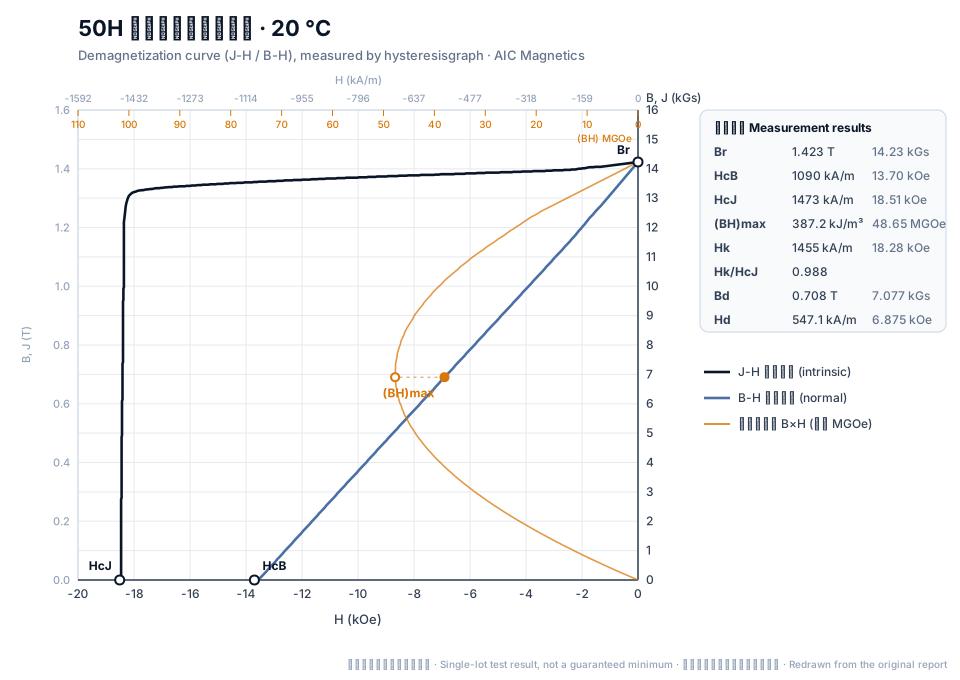
50H
50H measured at 20 °C: Br 1.423 T (14.23 kGs), HcJ 1473 kA/m (18.51 kOe), (BH)max 387.2 kJ/m³ (48.65 MGOe), Hk/HcJ 0.988.
View the original test report (scan) →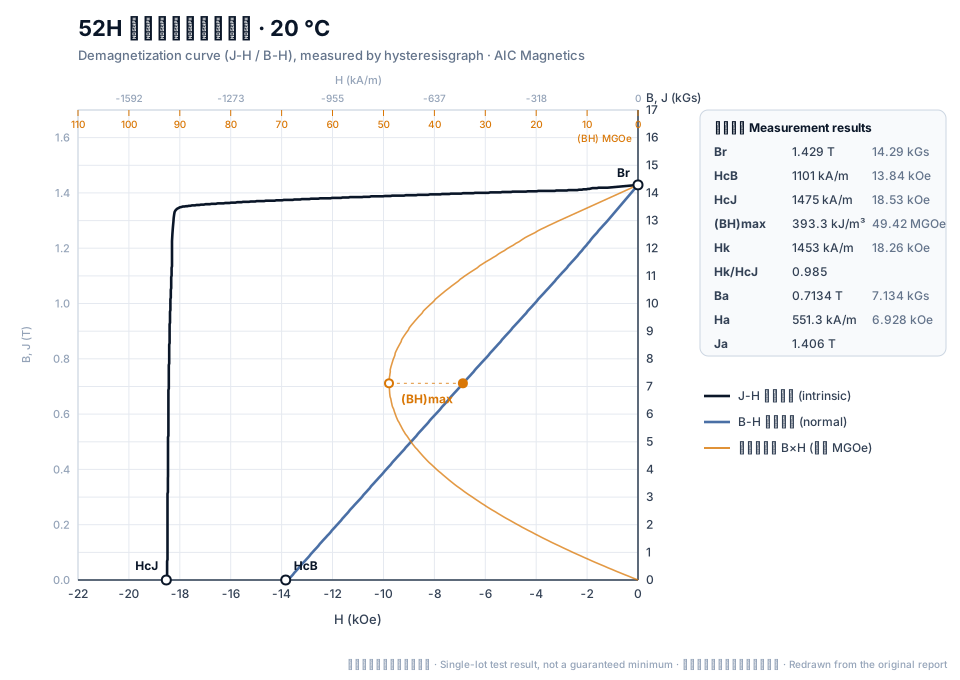
52H
52H measured at 20 °C: Br 1.429 T (14.29 kGs), HcJ 1475 kA/m (18.53 kOe), (BH)max 393.3 kJ/m³ (49.42 MGOe), Hk/HcJ 0.985.
View the original test report (scan) →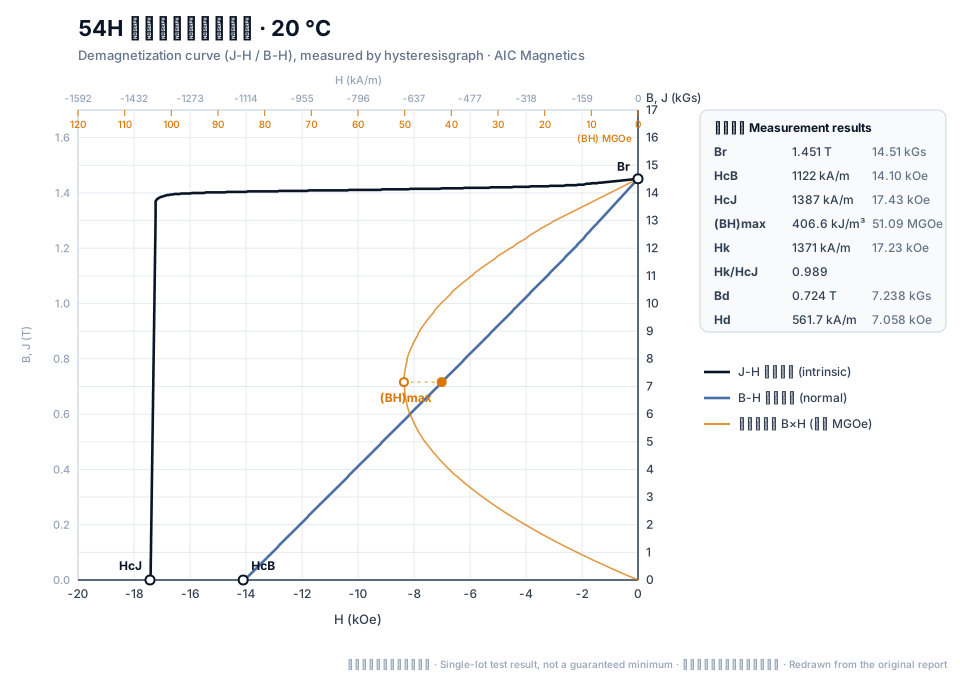
54H
54H measured at 20 °C: Br 1.451 T (14.51 kGs), HcJ 1387 kA/m (17.43 kOe), (BH)max 406.6 kJ/m³ (51.09 MGOe), Hk/HcJ 0.989.
View the original test report (scan) →SH series — super-high coercivity (≤ 150 °C)
30SH
30SH measured at 20 °C: Br 1.114 T (11.14 kGs), HcJ 1730 kA/m (21.74 kOe), (BH)max 239.7 kJ/m³ (30.12 MGOe), Hk/HcJ 0.971.
View the original test report (scan) →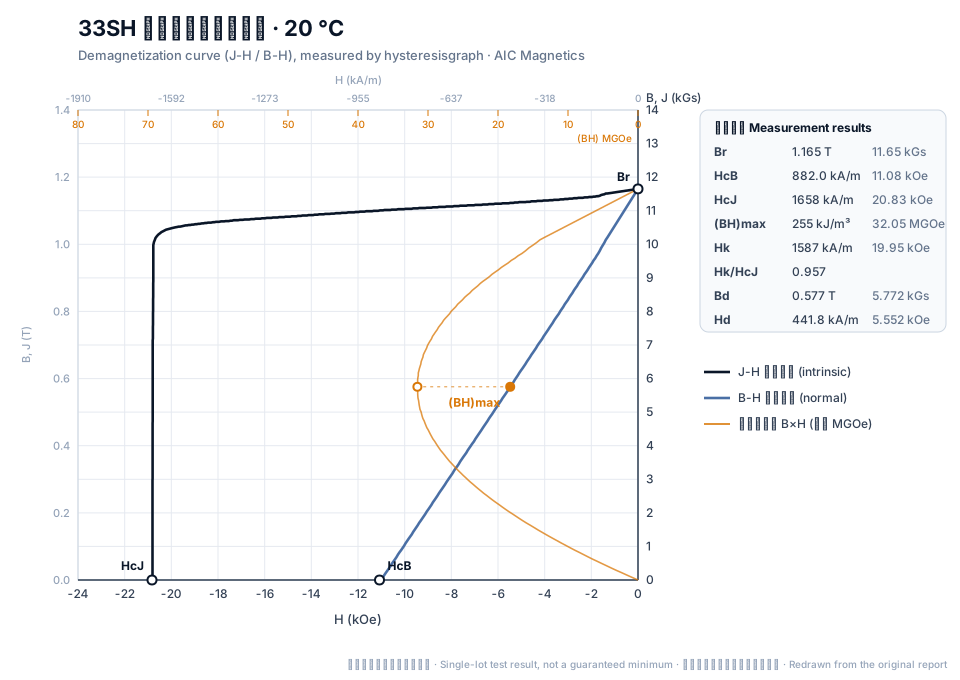
33SH
33SH measured at 20 °C: Br 1.165 T (11.65 kGs), HcJ 1658 kA/m (20.83 kOe), (BH)max 255 kJ/m³ (32.05 MGOe), Hk/HcJ 0.957.
View the original test report (scan) →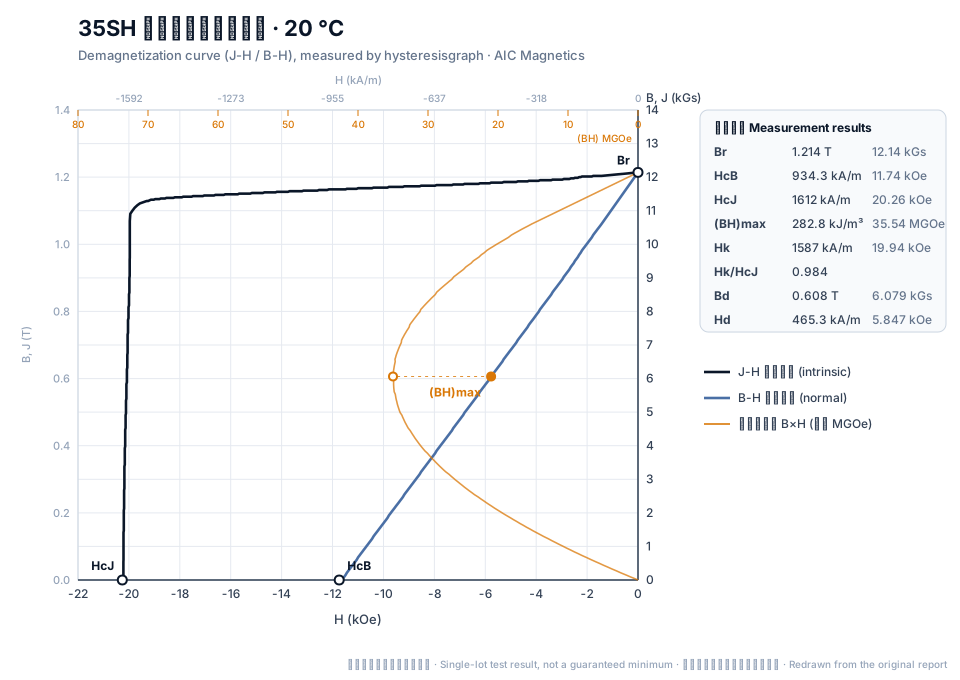
35SH
35SH measured at 20 °C: Br 1.214 T (12.14 kGs), HcJ 1612 kA/m (20.26 kOe), (BH)max 282.8 kJ/m³ (35.54 MGOe), Hk/HcJ 0.984.
View the original test report (scan) →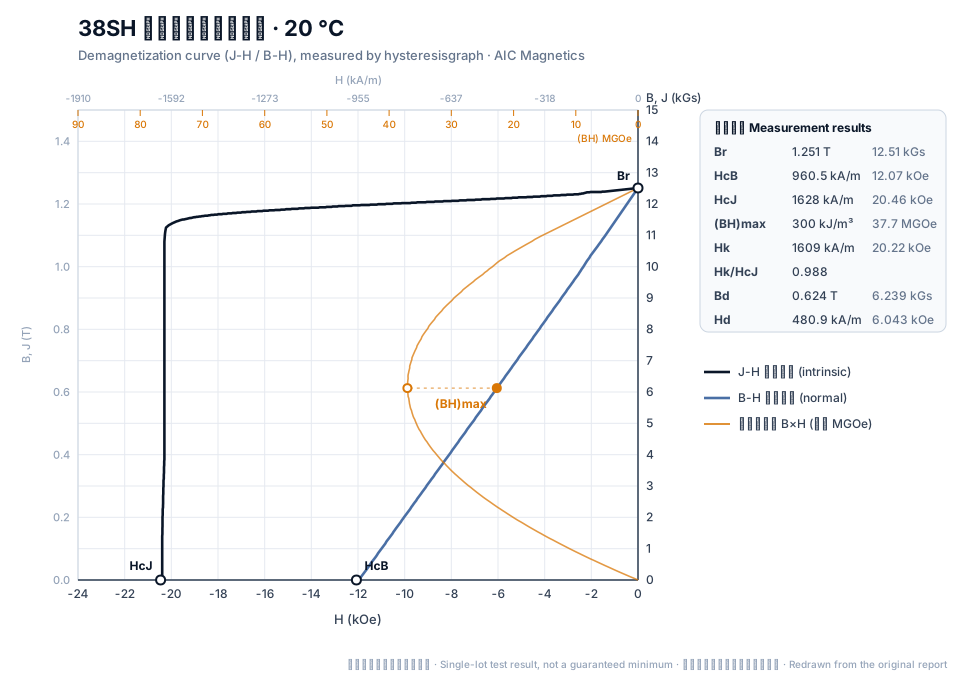
38SH
38SH measured at 20 °C: Br 1.251 T (12.51 kGs), HcJ 1628 kA/m (20.46 kOe), (BH)max 300 kJ/m³ (37.7 MGOe), Hk/HcJ 0.988.
View the original test report (scan) →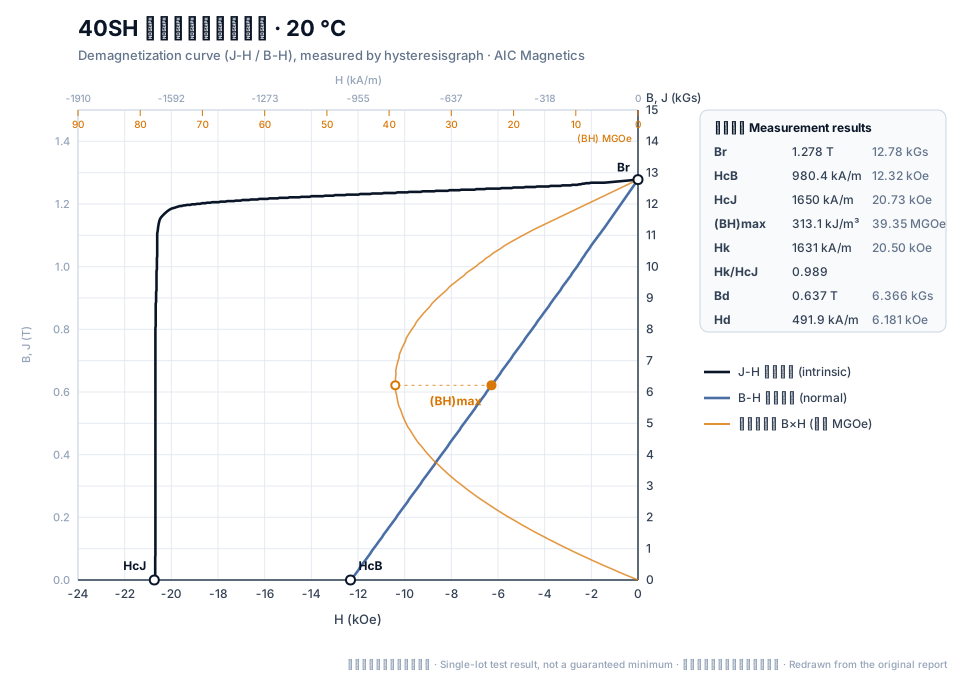
40SH
40SH measured at 20 °C: Br 1.278 T (12.78 kGs), HcJ 1650 kA/m (20.73 kOe), (BH)max 313.1 kJ/m³ (39.35 MGOe), Hk/HcJ 0.989.
View the original test report (scan) →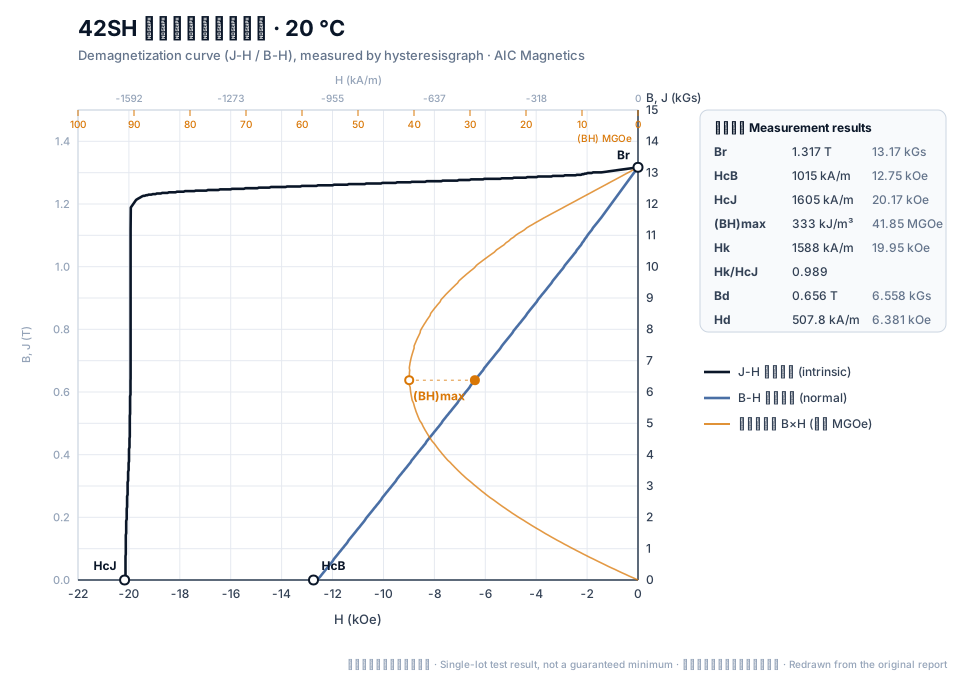
42SH
42SH measured at 20 °C: Br 1.317 T (13.17 kGs), HcJ 1605 kA/m (20.17 kOe), (BH)max 333 kJ/m³ (41.85 MGOe), Hk/HcJ 0.989.
View the original test report (scan) →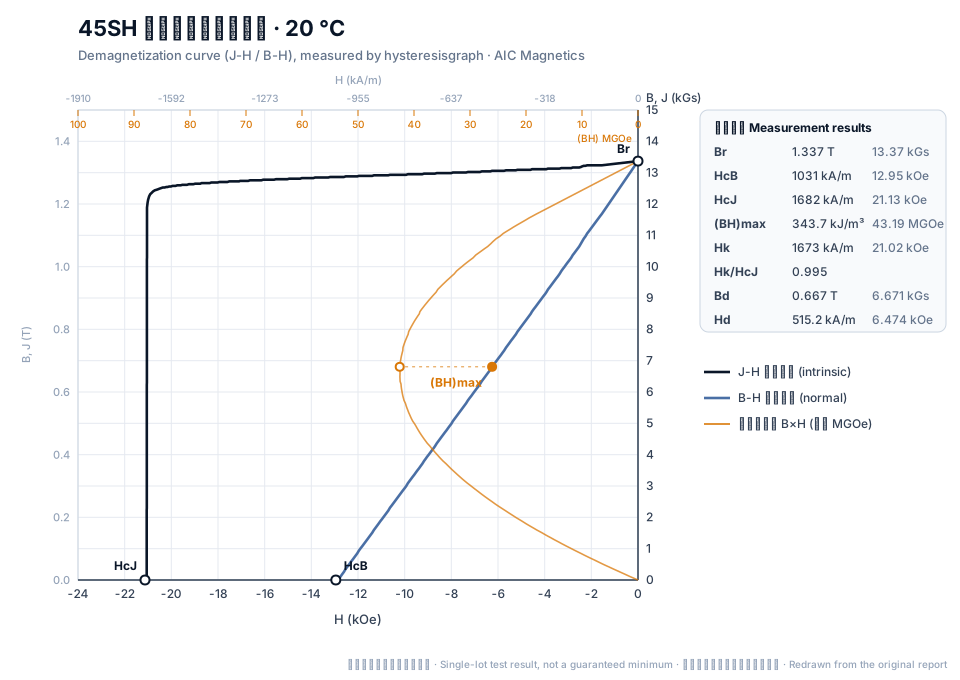
45SH
45SH measured at 20 °C: Br 1.337 T (13.37 kGs), HcJ 1682 kA/m (21.13 kOe), (BH)max 343.7 kJ/m³ (43.19 MGOe), Hk/HcJ 0.995.
View the original test report (scan) →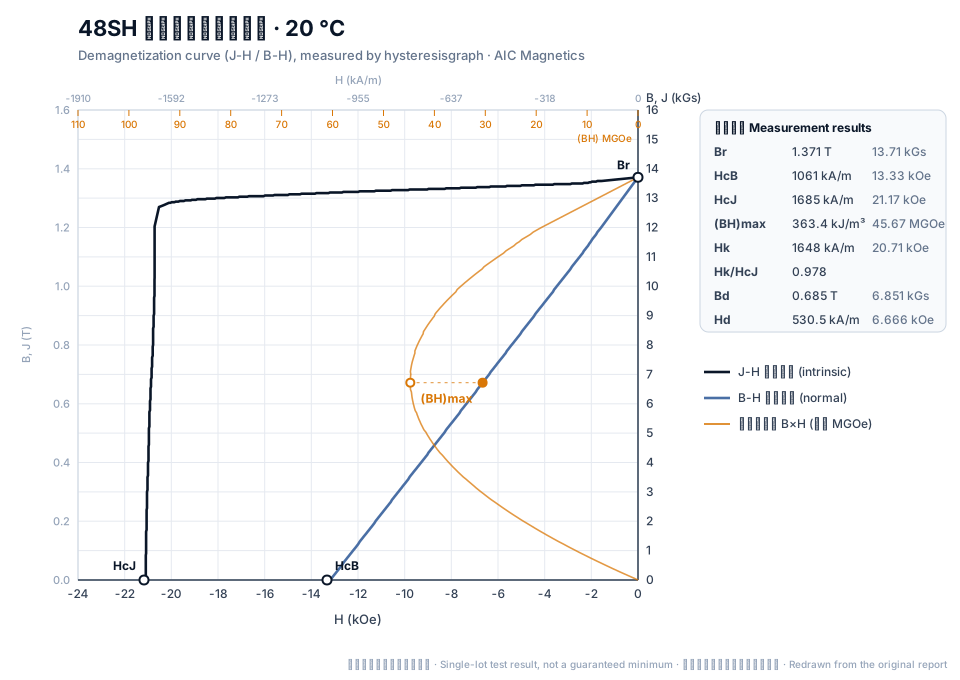
48SH
48SH measured at 20 °C: Br 1.371 T (13.71 kGs), HcJ 1685 kA/m (21.17 kOe), (BH)max 363.4 kJ/m³ (45.67 MGOe), Hk/HcJ 0.978.
View the original test report (scan) →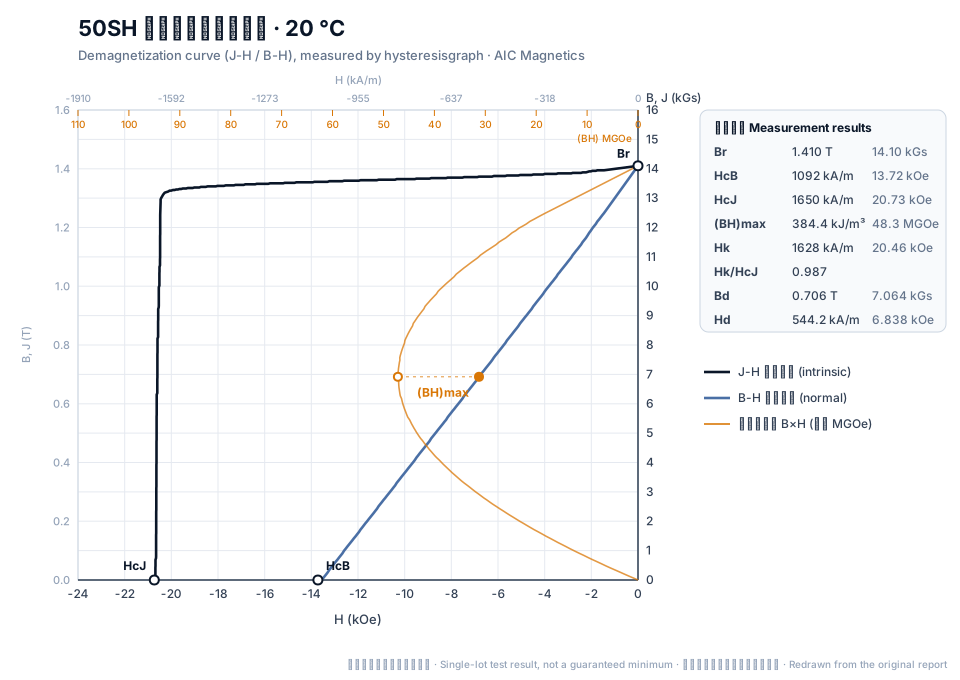
50SH
50SH measured at 20 °C: Br 1.410 T (14.10 kGs), HcJ 1650 kA/m (20.73 kOe), (BH)max 384.4 kJ/m³ (48.3 MGOe), Hk/HcJ 0.987.
View the original test report (scan) →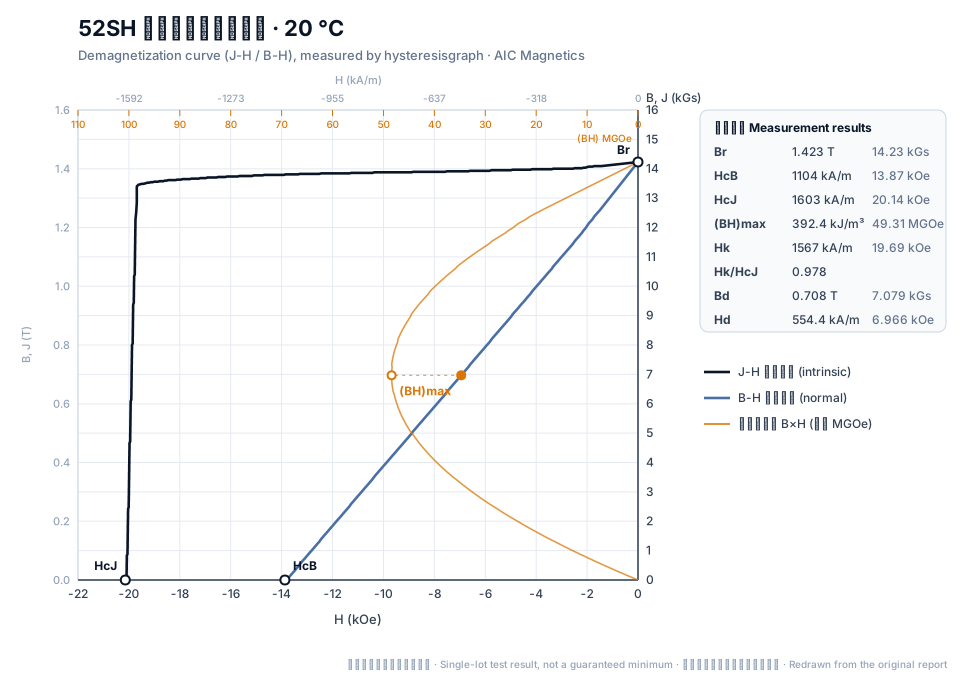
52SH
52SH measured at 20 °C: Br 1.423 T (14.23 kGs), HcJ 1603 kA/m (20.14 kOe), (BH)max 392.4 kJ/m³ (49.31 MGOe), Hk/HcJ 0.978.
View the original test report (scan) →UH series — ultra-high coercivity (≤ 180 °C)
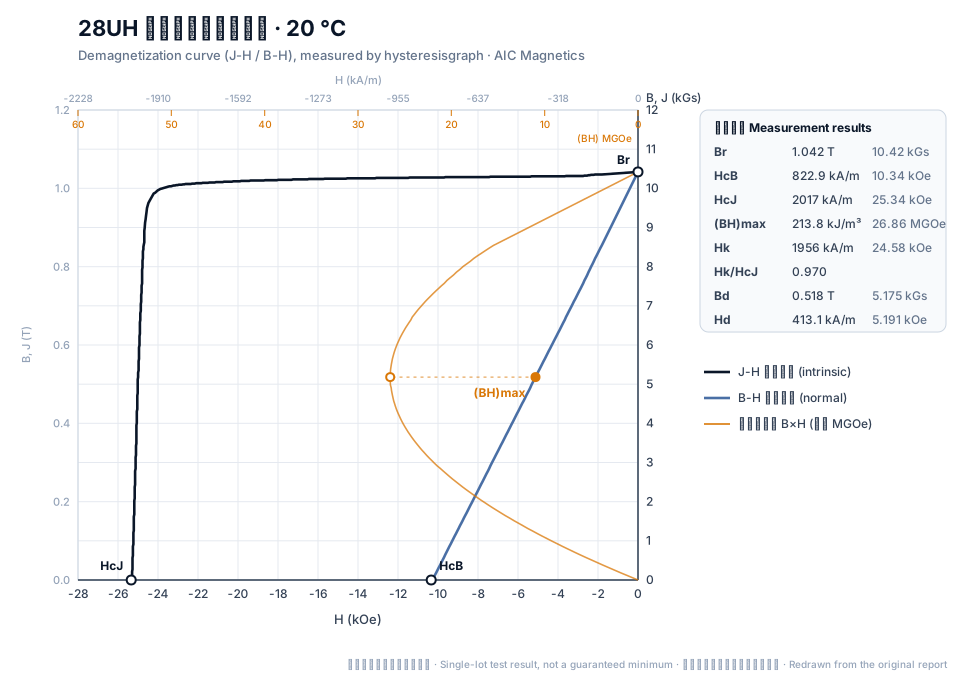
28UH
28UH measured at 20 °C: Br 1.042 T (10.42 kGs), HcJ 2017 kA/m (25.34 kOe), (BH)max 213.8 kJ/m³ (26.86 MGOe), Hk/HcJ 0.970.
View the original test report (scan) →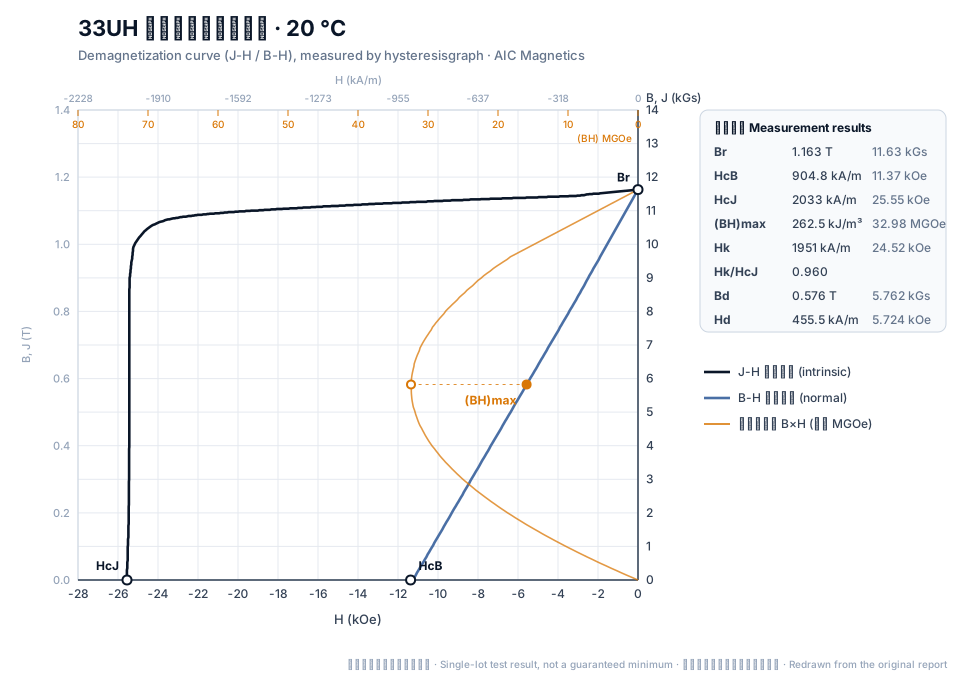
33UH
33UH measured at 20 °C: Br 1.163 T (11.63 kGs), HcJ 2033 kA/m (25.55 kOe), (BH)max 262.5 kJ/m³ (32.98 MGOe), Hk/HcJ 0.960.
View the original test report (scan) →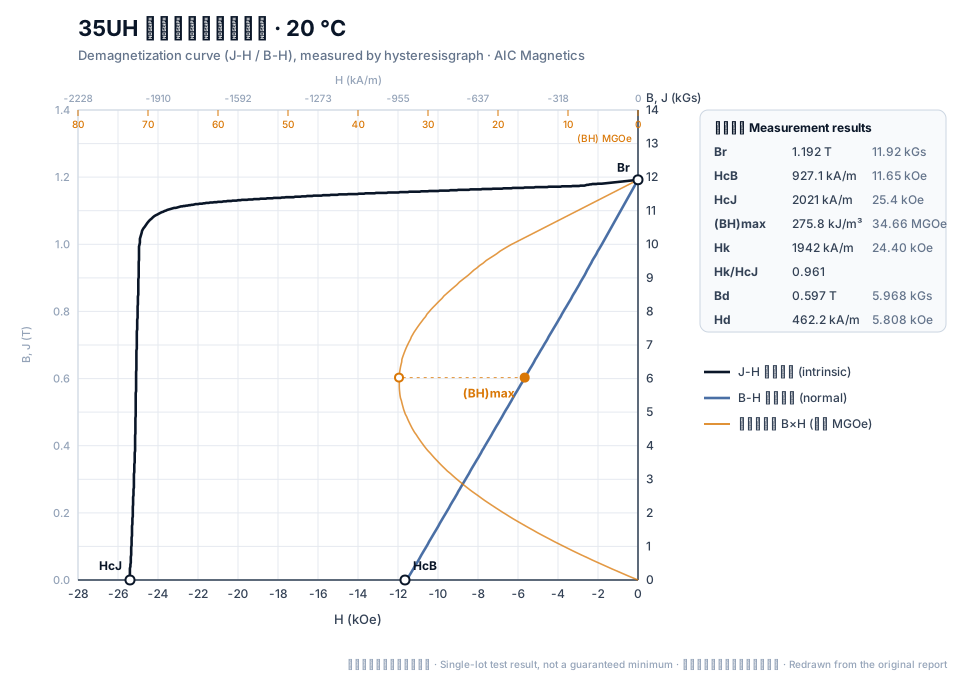
35UH
35UH measured at 20 °C: Br 1.192 T (11.92 kGs), HcJ 2021 kA/m (25.4 kOe), (BH)max 275.8 kJ/m³ (34.66 MGOe), Hk/HcJ 0.961.
View the original test report (scan) →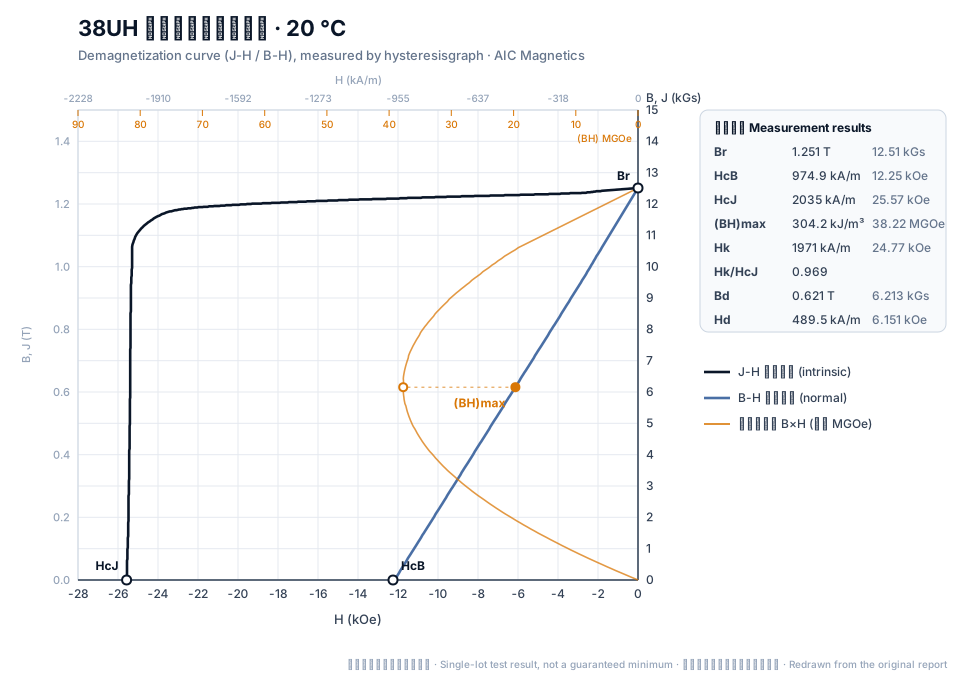
38UH
38UH measured at 20 °C: Br 1.251 T (12.51 kGs), HcJ 2035 kA/m (25.57 kOe), (BH)max 304.2 kJ/m³ (38.22 MGOe), Hk/HcJ 0.969.
View the original test report (scan) →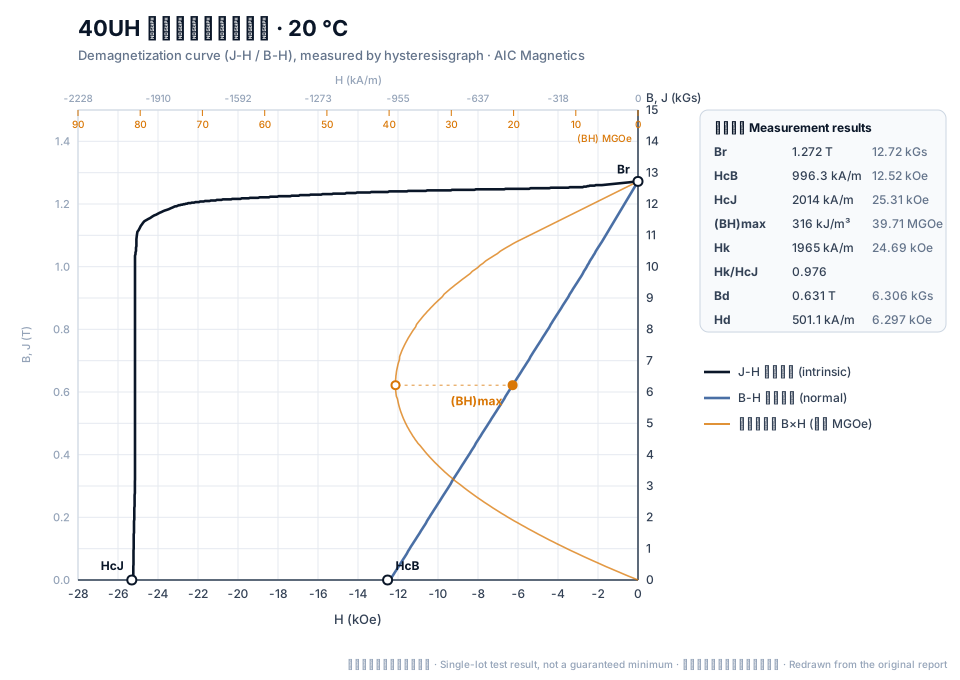
40UH
40UH measured at 20 °C: Br 1.272 T (12.72 kGs), HcJ 2014 kA/m (25.31 kOe), (BH)max 316 kJ/m³ (39.71 MGOe), Hk/HcJ 0.976.
View the original test report (scan) →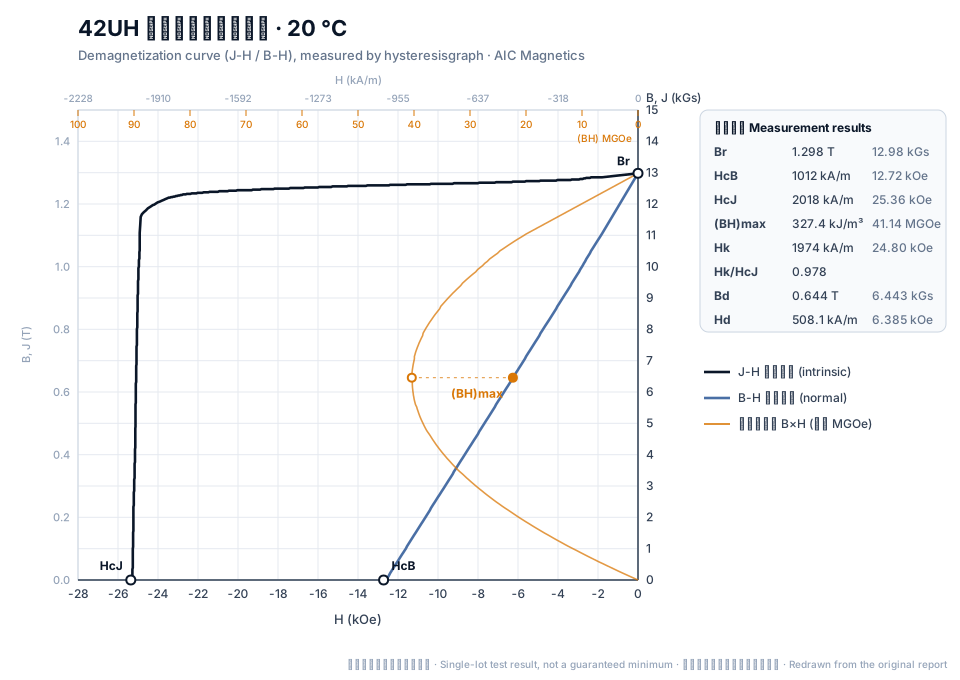
42UH
42UH measured at 20 °C: Br 1.298 T (12.98 kGs), HcJ 2018 kA/m (25.36 kOe), (BH)max 327.4 kJ/m³ (41.14 MGOe), Hk/HcJ 0.978.
View the original test report (scan) →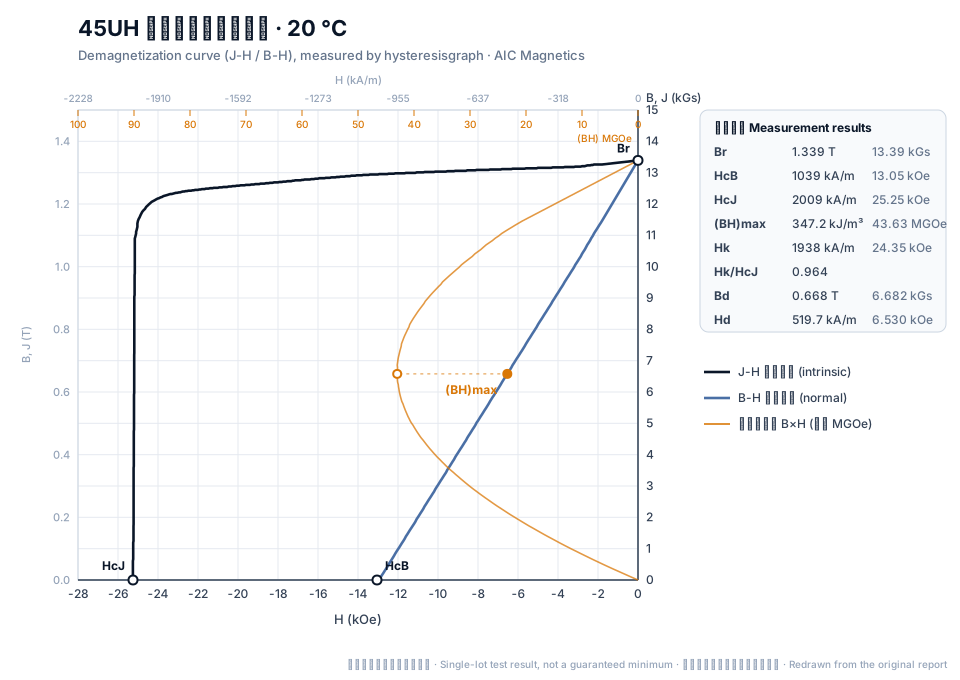
45UH
45UH measured at 20 °C: Br 1.339 T (13.39 kGs), HcJ 2009 kA/m (25.25 kOe), (BH)max 347.2 kJ/m³ (43.63 MGOe), Hk/HcJ 0.964.
View the original test report (scan) →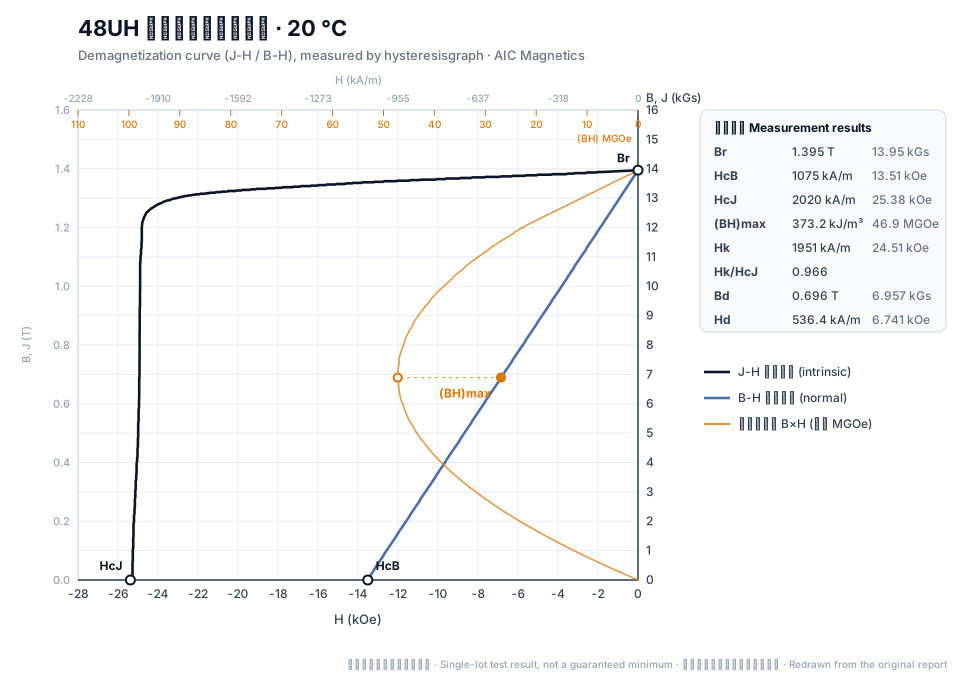
48UH
48UH measured at 20 °C: Br 1.395 T (13.95 kGs), HcJ 2020 kA/m (25.38 kOe), (BH)max 373.2 kJ/m³ (46.9 MGOe), Hk/HcJ 0.966.
View the original test report (scan) →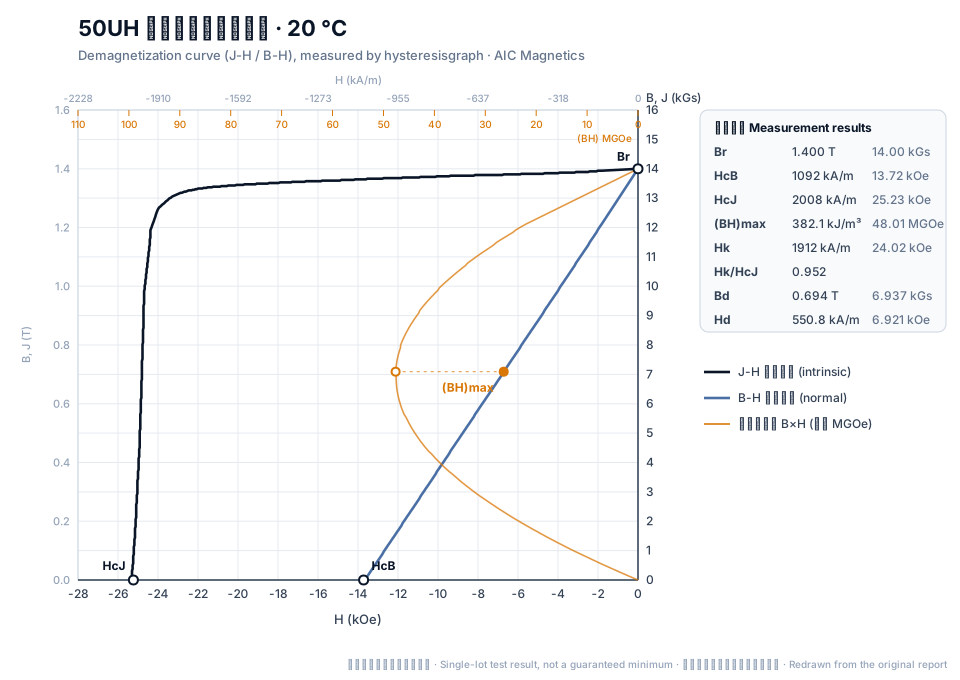
50UH
50UH measured at 20 °C: Br 1.400 T (14.00 kGs), HcJ 2008 kA/m (25.23 kOe), (BH)max 382.1 kJ/m³ (48.01 MGOe), Hk/HcJ 0.952.
View the original test report (scan) →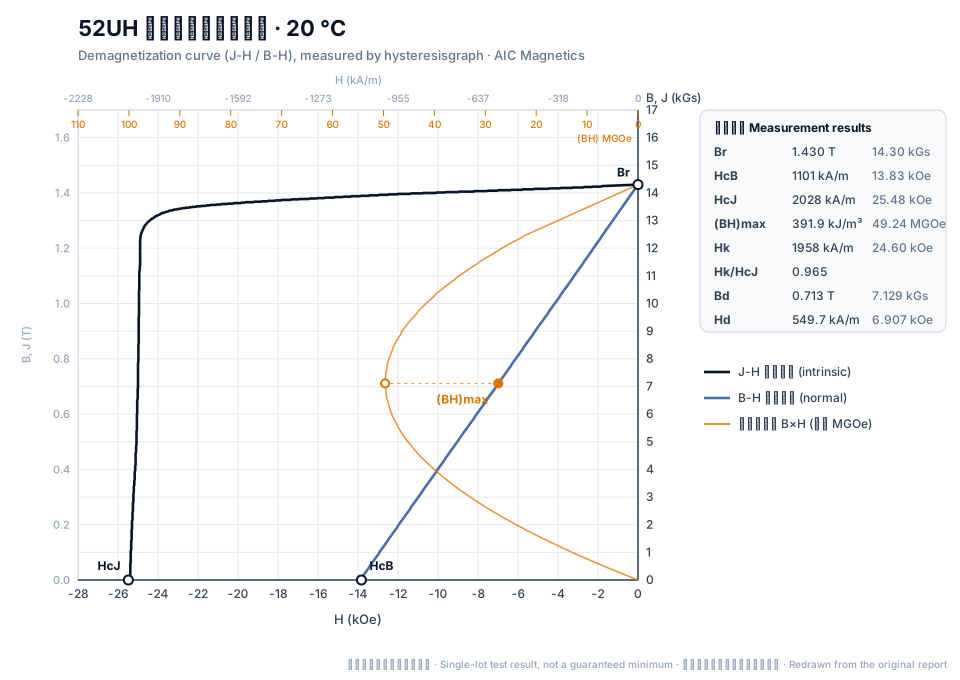
52UH
52UH measured at 20 °C: Br 1.430 T (14.30 kGs), HcJ 2028 kA/m (25.48 kOe), (BH)max 391.9 kJ/m³ (49.24 MGOe), Hk/HcJ 0.965.
View the original test report (scan) →EH series — extra-high coercivity (≤ 200 °C)
30EH
30EH measured at 20 °C: Br 1.095 T (10.95 kGs), HcJ 2418 kA/m (30.39 kOe), (BH)max 231.9 kJ/m³ (29.14 MGOe), Hk/HcJ 0.929.
View the original test report (scan) →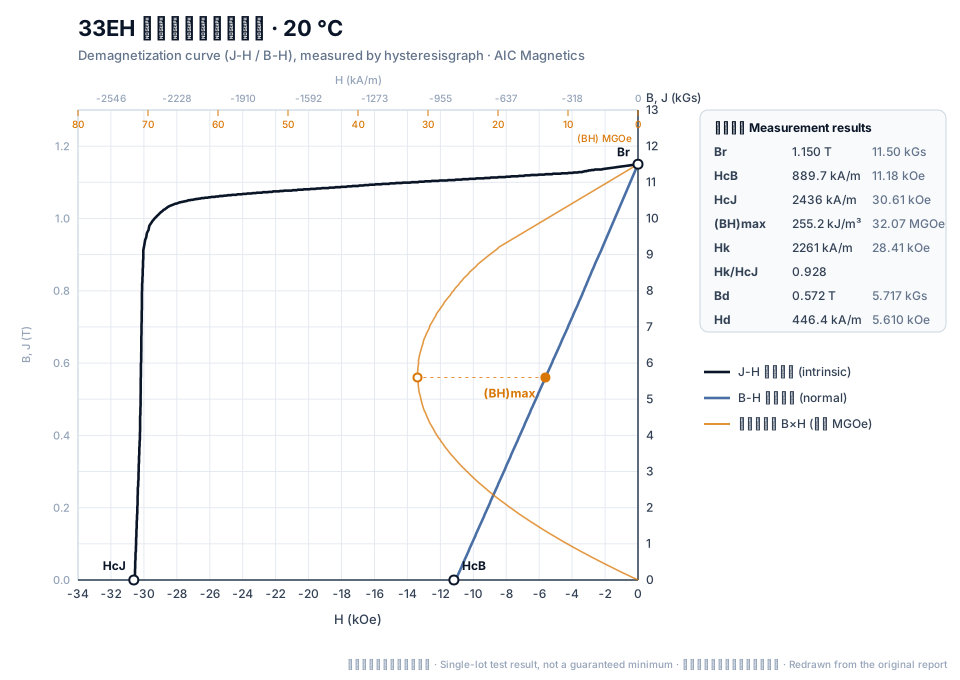
33EH
33EH measured at 20 °C: Br 1.150 T (11.50 kGs), HcJ 2436 kA/m (30.61 kOe), (BH)max 255.2 kJ/m³ (32.07 MGOe), Hk/HcJ 0.928.
View the original test report (scan) →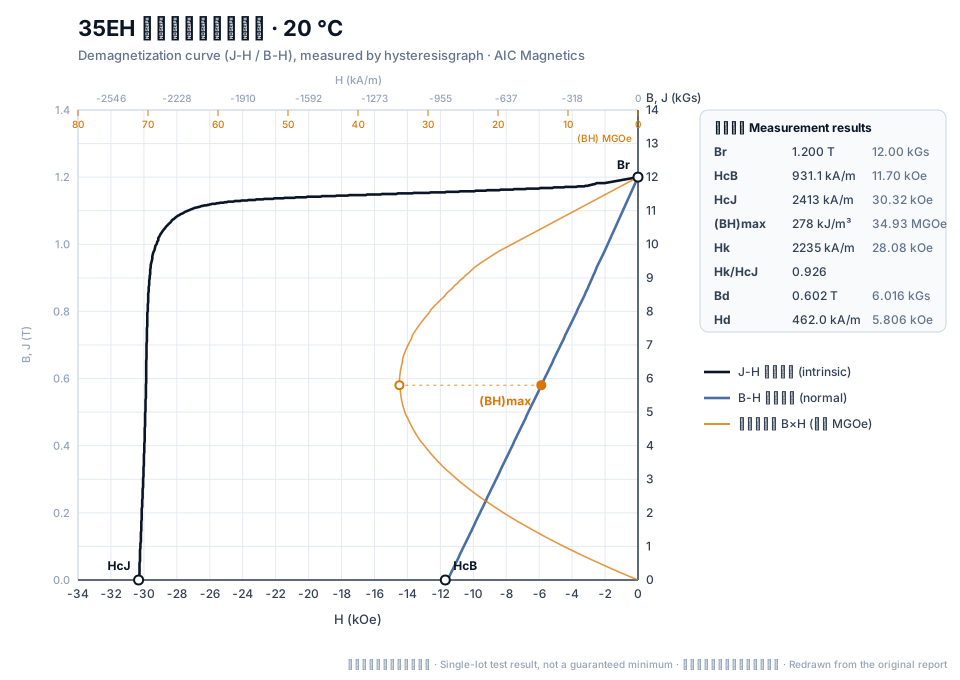
35EH
35EH measured at 20 °C: Br 1.200 T (12.00 kGs), HcJ 2413 kA/m (30.32 kOe), (BH)max 278 kJ/m³ (34.93 MGOe), Hk/HcJ 0.926.
View the original test report (scan) →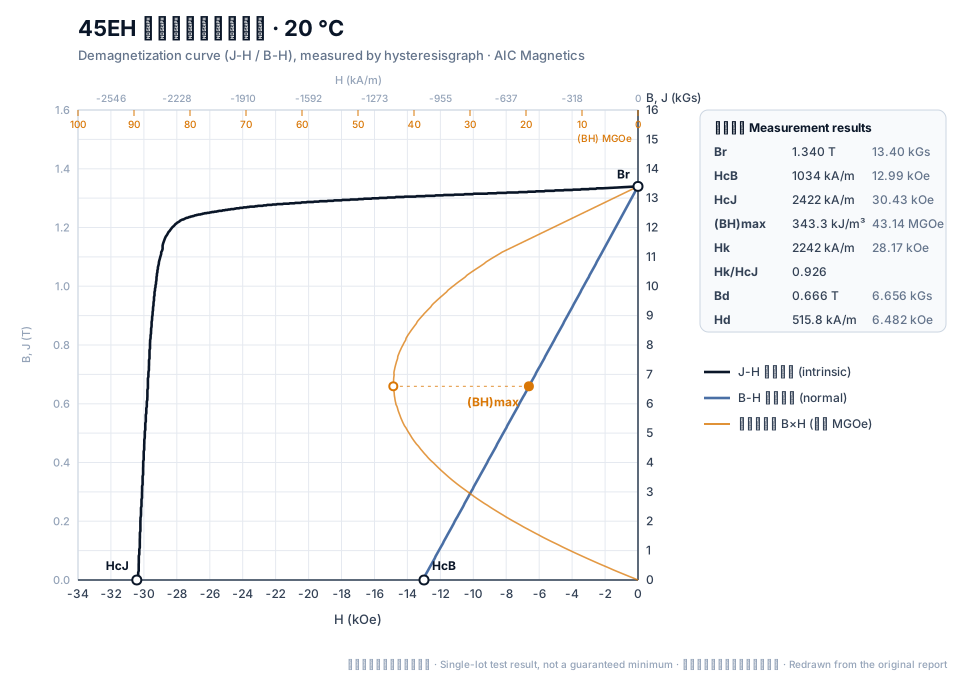
45EH
45EH measured at 20 °C: Br 1.340 T (13.40 kGs), HcJ 2422 kA/m (30.43 kOe), (BH)max 343.3 kJ/m³ (43.14 MGOe), Hk/HcJ 0.926.
View the original test report (scan) →Cerium-containing grades (C prefix)
Part of the neodymium/praseodymium is replaced by cerium, a cheaper and more plentiful rare earth. Br and (BH)max stay close to the standard grade, HcJ runs a little lower — a cost-saving option for consumer products and motors with moderate temperature demands.
CN33
CN33 measured at 20 °C: Br 1.171 T (11.71 kGs), HcJ 995.5 kA/m (12.51 kOe), (BH)max 263.6 kJ/m³ (33.12 MGOe), Hk/HcJ 0.982.
View the original test report (scan) →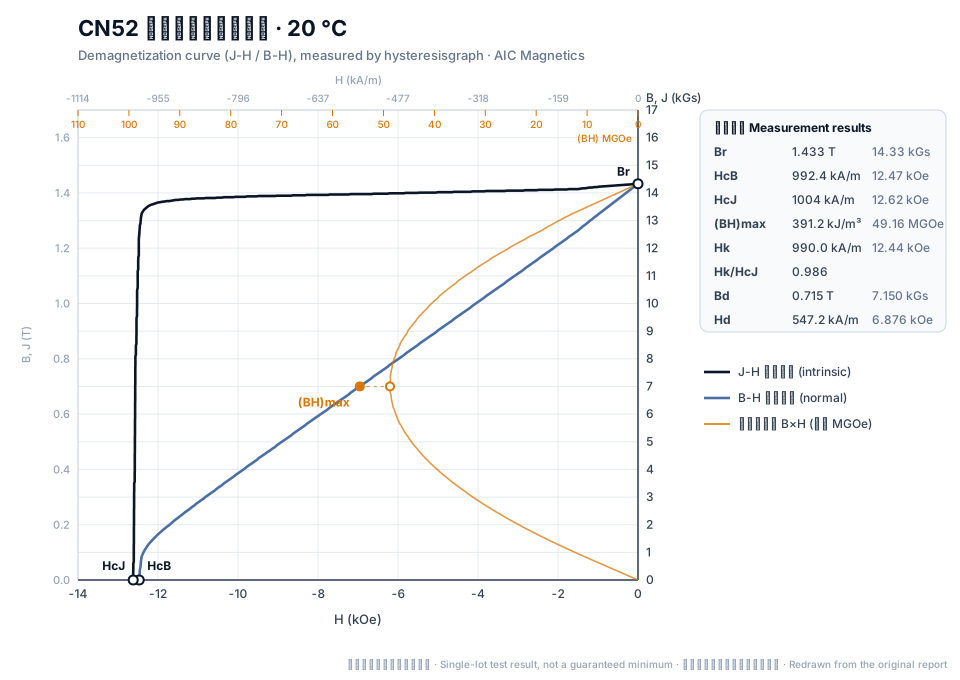
CN52
CN52 measured at 20 °C: Br 1.433 T (14.33 kGs), HcJ 1004 kA/m (12.62 kOe), (BH)max 391.2 kJ/m³ (49.16 MGOe), Hk/HcJ 0.986.
View the original test report (scan) →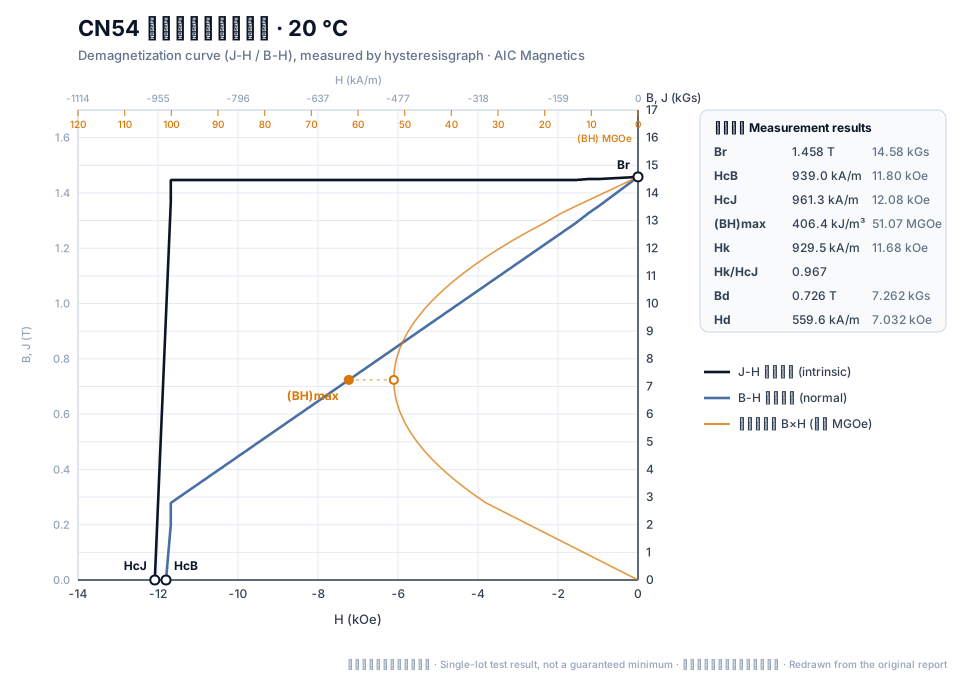
CN54
CN54 measured at 20 °C: Br 1.458 T (14.58 kGs), HcJ 961.3 kA/m (12.08 kOe), (BH)max 406.4 kJ/m³ (51.07 MGOe), Hk/HcJ 0.967.
View the original test report (scan) →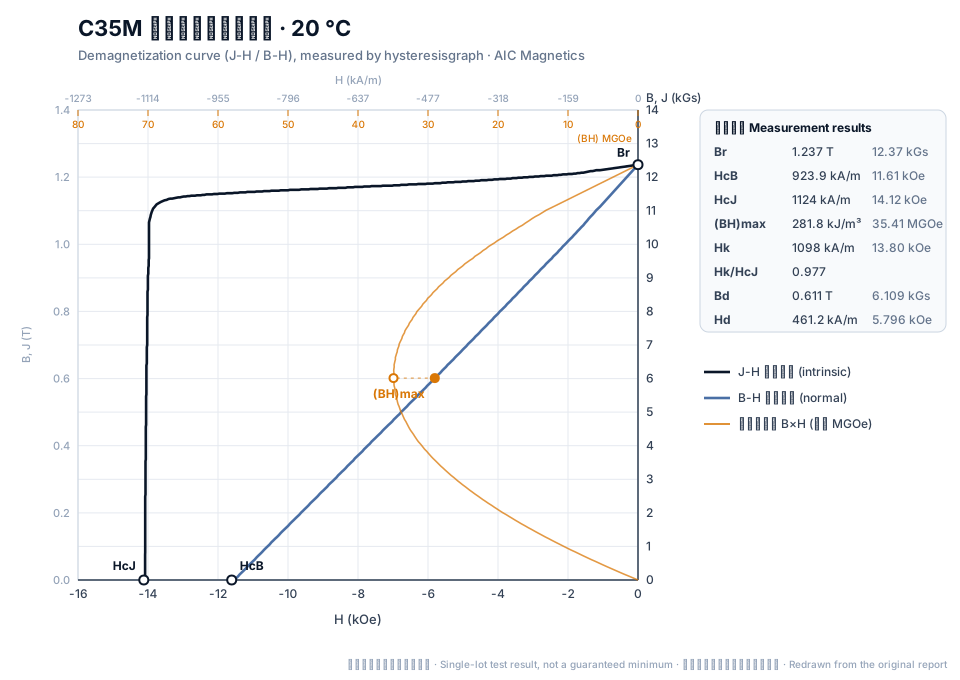
C35M
C35M measured at 20 °C: Br 1.237 T (12.37 kGs), HcJ 1124 kA/m (14.12 kOe), (BH)max 281.8 kJ/m³ (35.41 MGOe), Hk/HcJ 0.977.
View the original test report (scan) →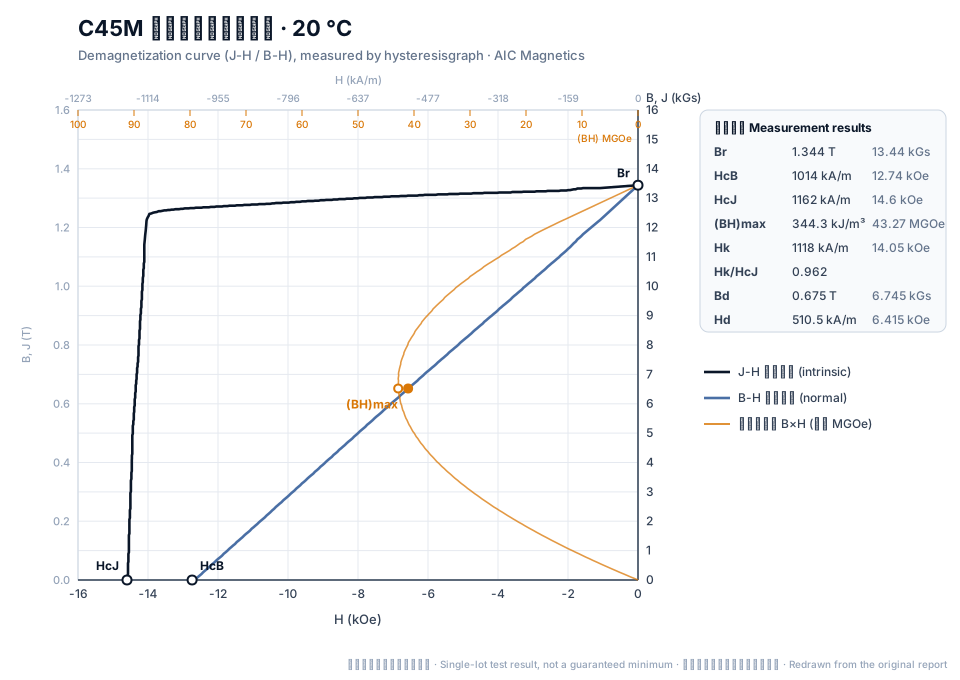
C45M
C45M measured at 20 °C: Br 1.344 T (13.44 kGs), HcJ 1162 kA/m (14.6 kOe), (BH)max 344.3 kJ/m³ (43.27 MGOe), Hk/HcJ 0.962.
View the original test report (scan) →Non-standard coercivity grades (T suffix)
T grades sit between two coercivity series: e.g. the SH class is graded at HcJ of about 20 kOe and above and UH at about 25 kOe and above, while 35SHT targets 22–23 kOe; the exact specification is agreed per order. They give extra temperature margin over the base series without paying for the next series up.
33MT
33MT measured at 20 °C: Br 1.167 T (11.67 kGs), HcJ 1198 kA/m (15.05 kOe), (BH)max 262.9 kJ/m³ (33.03 MGOe), Hk/HcJ 0.984.
View the original test report (scan) →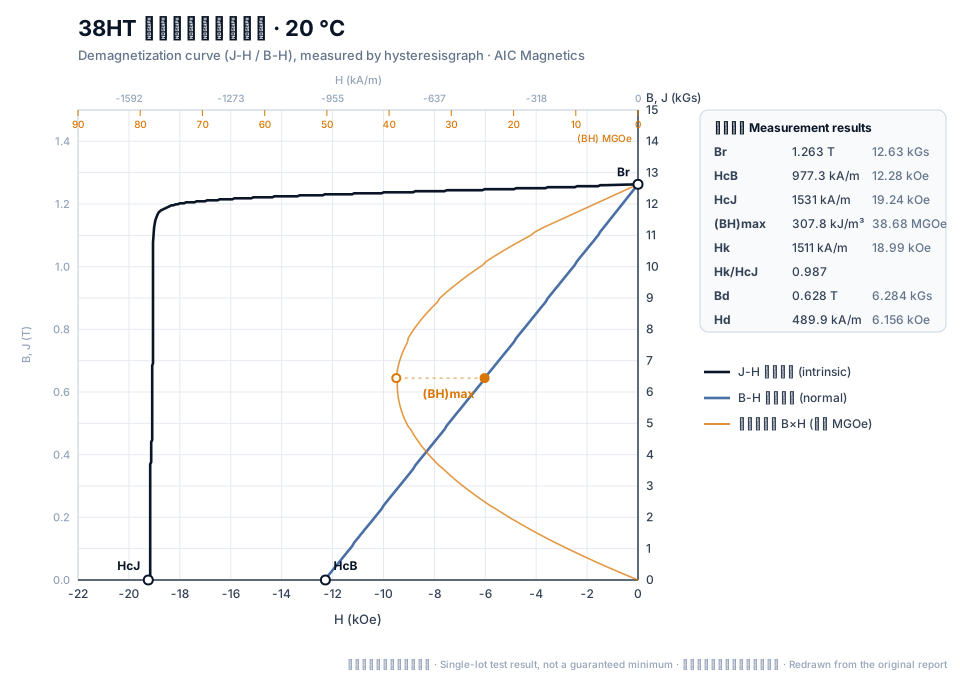
38HT
38HT measured at 20 °C: Br 1.263 T (12.63 kGs), HcJ 1531 kA/m (19.24 kOe), (BH)max 307.8 kJ/m³ (38.68 MGOe), Hk/HcJ 0.987.
View the original test report (scan) →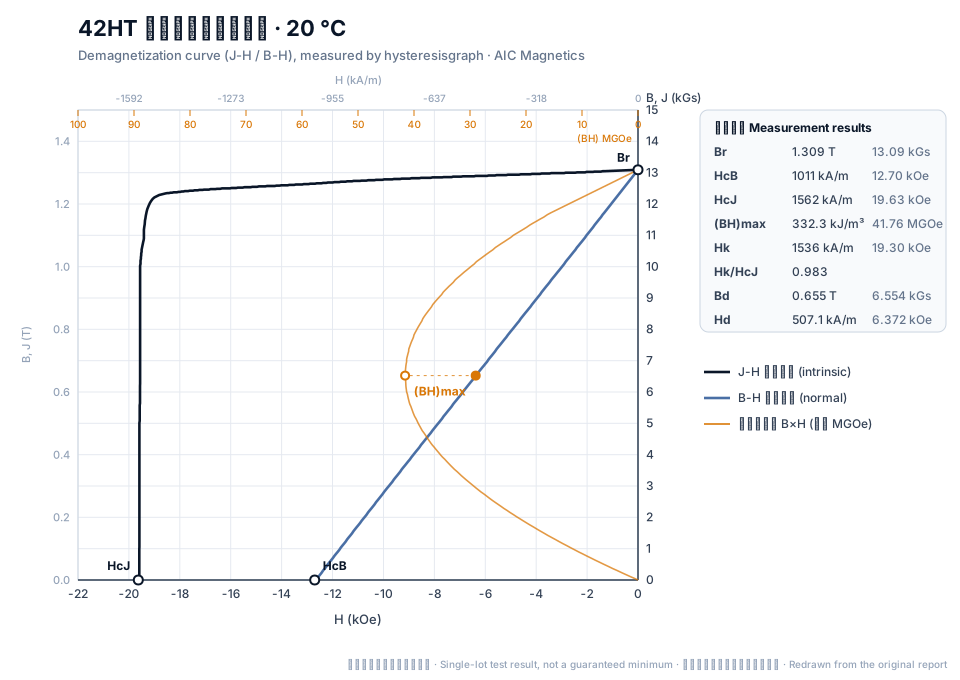
42HT
42HT measured at 20 °C: Br 1.309 T (13.09 kGs), HcJ 1562 kA/m (19.63 kOe), (BH)max 332.3 kJ/m³ (41.76 MGOe), Hk/HcJ 0.983.
View the original test report (scan) →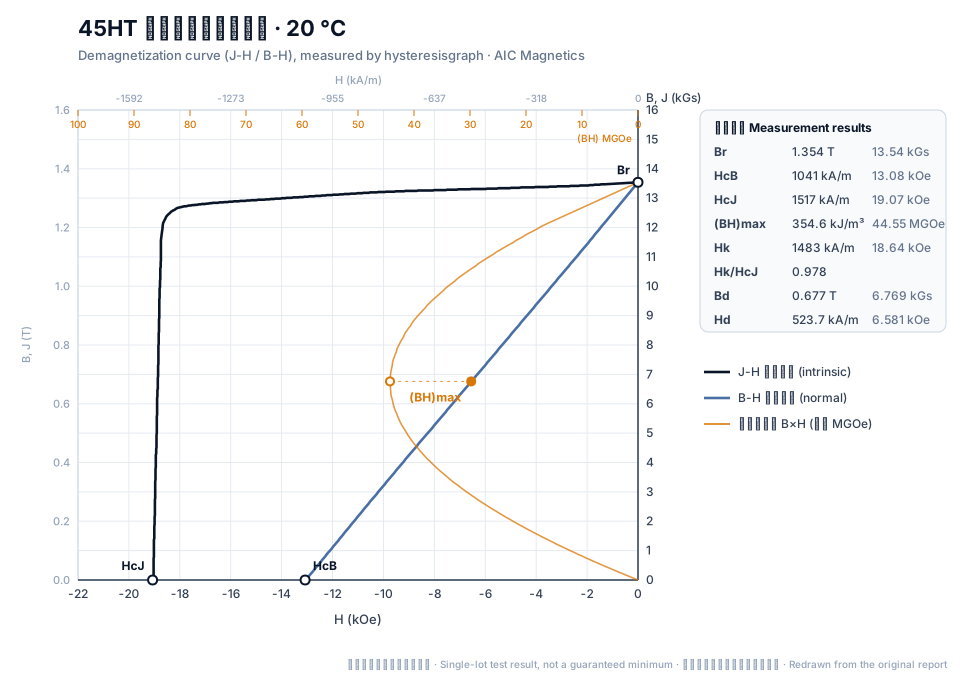
45HT
45HT measured at 20 °C: Br 1.354 T (13.54 kGs), HcJ 1517 kA/m (19.07 kOe), (BH)max 354.6 kJ/m³ (44.55 MGOe), Hk/HcJ 0.978.
View the original test report (scan) →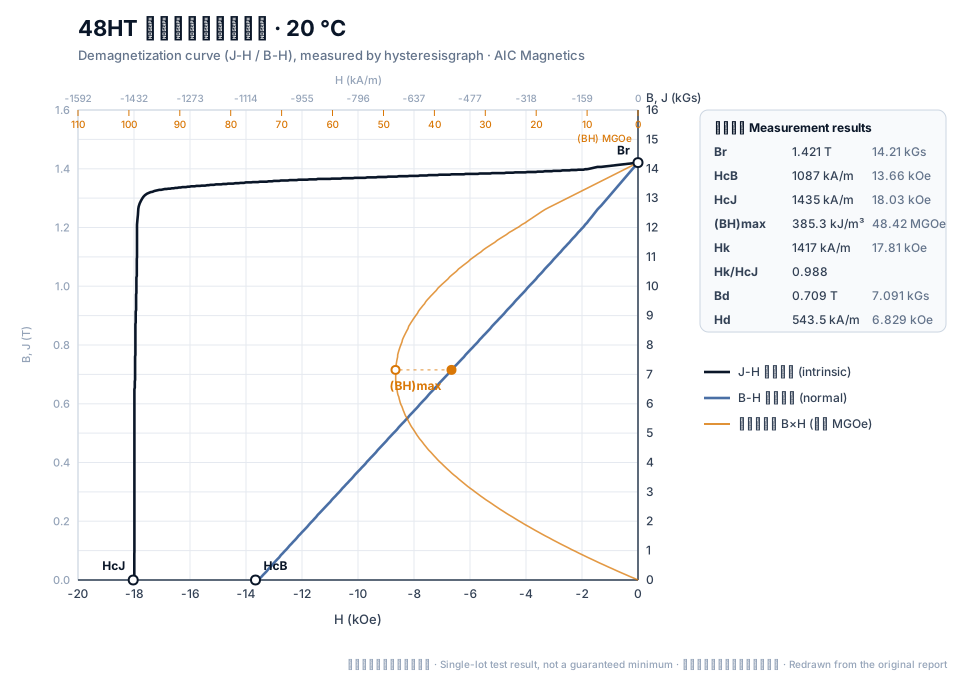
48HT
48HT measured at 20 °C: Br 1.421 T (14.21 kGs), HcJ 1435 kA/m (18.03 kOe), (BH)max 385.3 kJ/m³ (48.42 MGOe), Hk/HcJ 0.988.
View the original test report (scan) →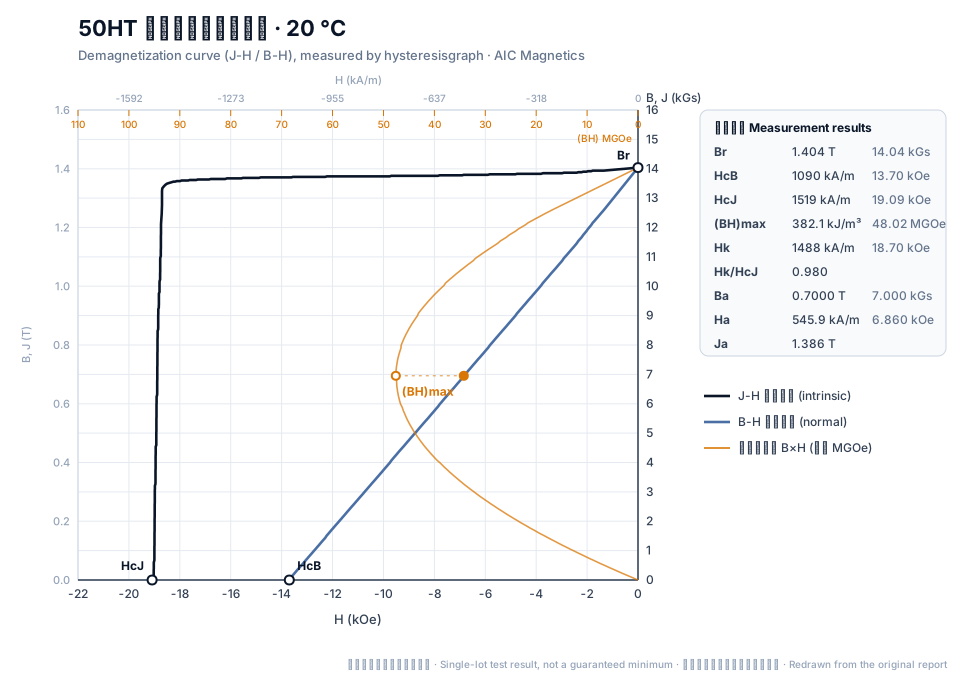
50HT
50HT measured at 20 °C: Br 1.404 T (14.04 kGs), HcJ 1519 kA/m (19.09 kOe), (BH)max 382.1 kJ/m³ (48.02 MGOe), Hk/HcJ 0.980.
View the original test report (scan) →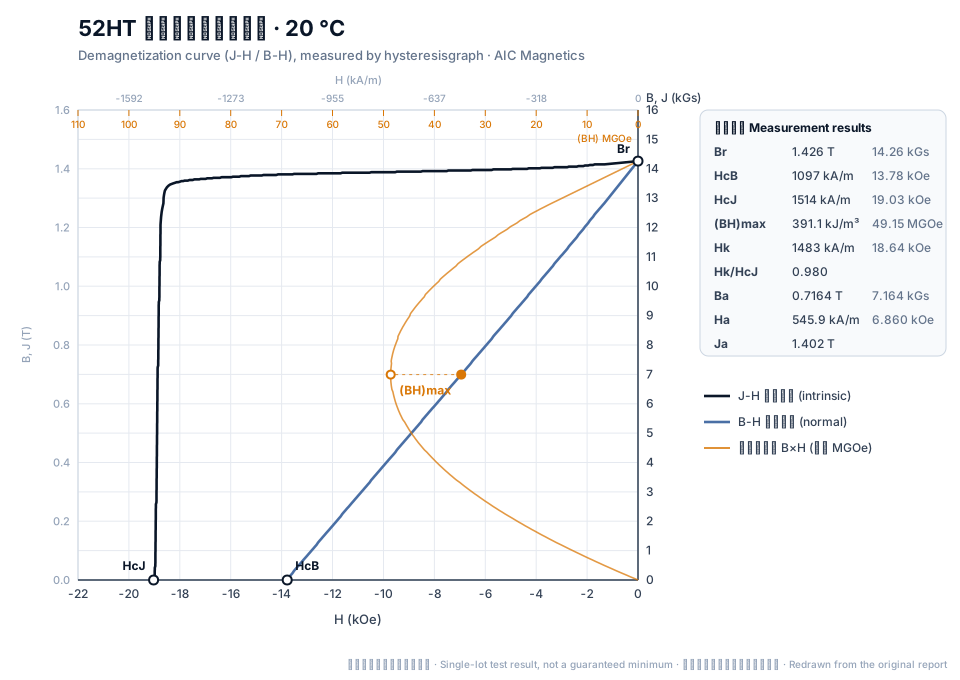
52HT
52HT measured at 20 °C: Br 1.426 T (14.26 kGs), HcJ 1514 kA/m (19.03 kOe), (BH)max 391.1 kJ/m³ (49.15 MGOe), Hk/HcJ 0.980.
View the original test report (scan) →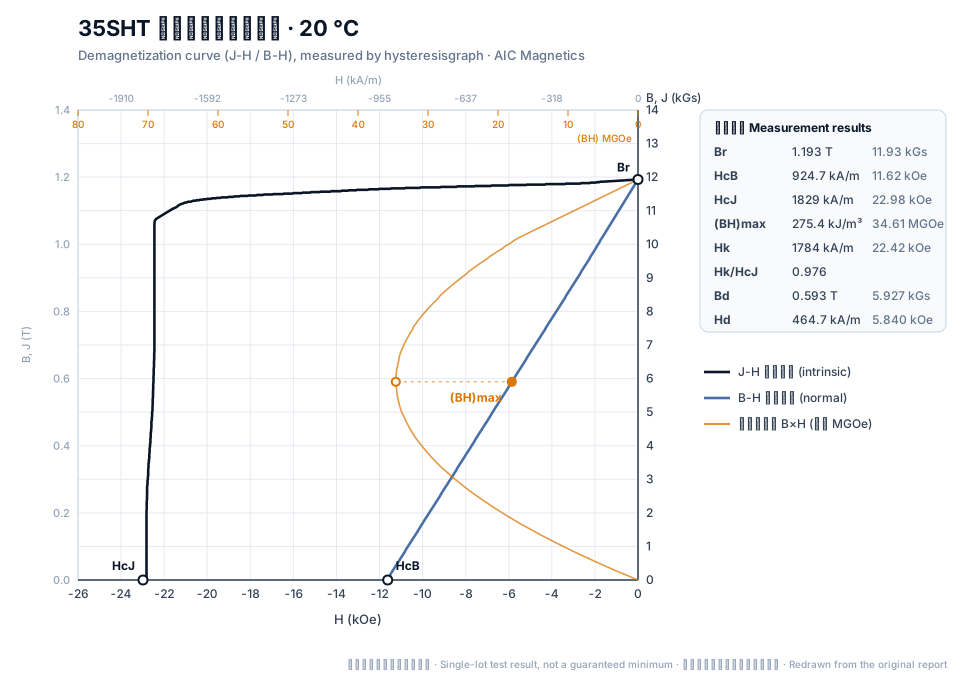
35SHT
35SHT measured at 20 °C: Br 1.193 T (11.93 kGs), HcJ 1829 kA/m (22.98 kOe), (BH)max 275.4 kJ/m³ (34.61 MGOe), Hk/HcJ 0.976.
View the original test report (scan) →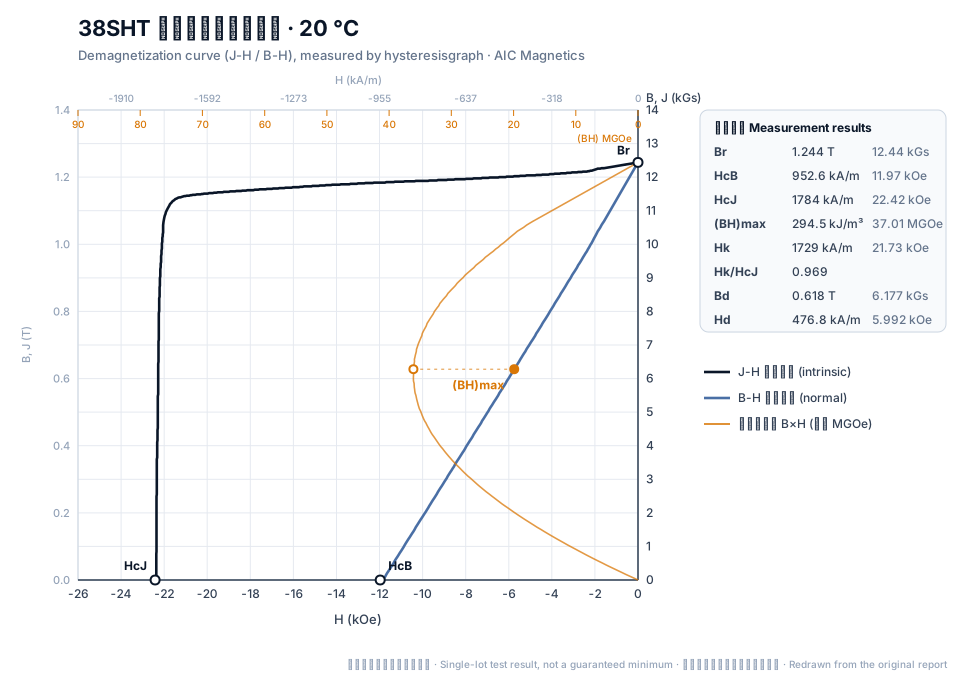
38SHT
38SHT measured at 20 °C: Br 1.244 T (12.44 kGs), HcJ 1784 kA/m (22.42 kOe), (BH)max 294.5 kJ/m³ (37.01 MGOe), Hk/HcJ 0.969.
View the original test report (scan) →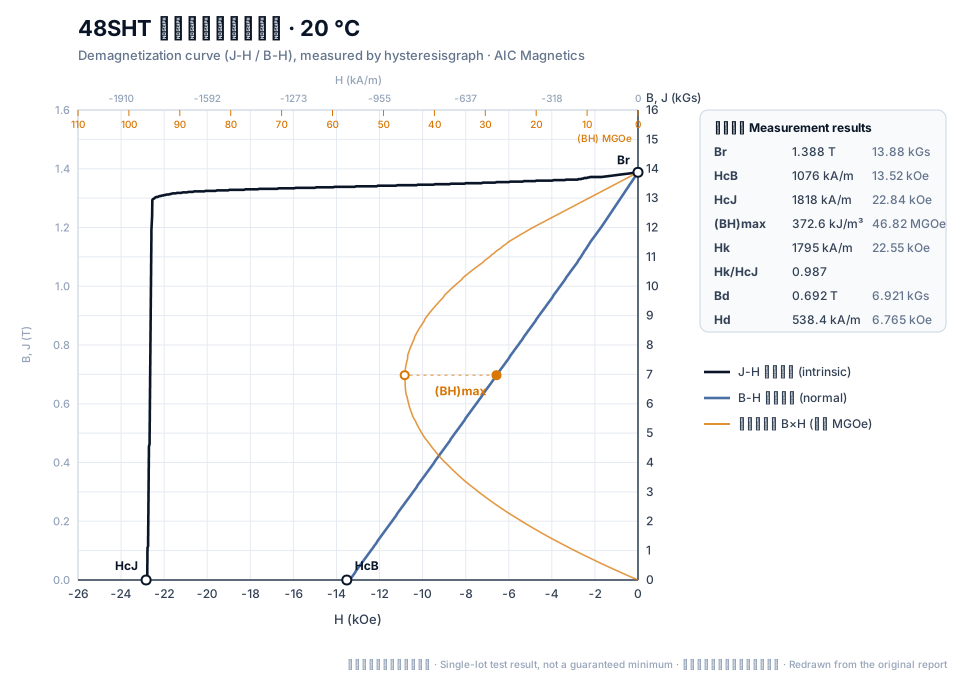
48SHT
48SHT measured at 20 °C: Br 1.388 T (13.88 kGs), HcJ 1818 kA/m (22.84 kOe), (BH)max 372.6 kJ/m³ (46.82 MGOe), Hk/HcJ 0.987.
View the original test report (scan) →Variable-temperature demagnetization curves
Each set is one sample measured at rising temperatures; these samples are from different lots than the 20 °C curves above, so their 20 °C values differ slightly. Br falls slowly (about −0.10 to −0.12 %/°C) while HcJ falls fast (about −0.4 to −0.8 %/°C), so the J-H knee moves towards the origin. As a first check, the worst-case working point at that temperature should stay above the knee with some margin; final design still needs a calculation for the actual geometry and load.
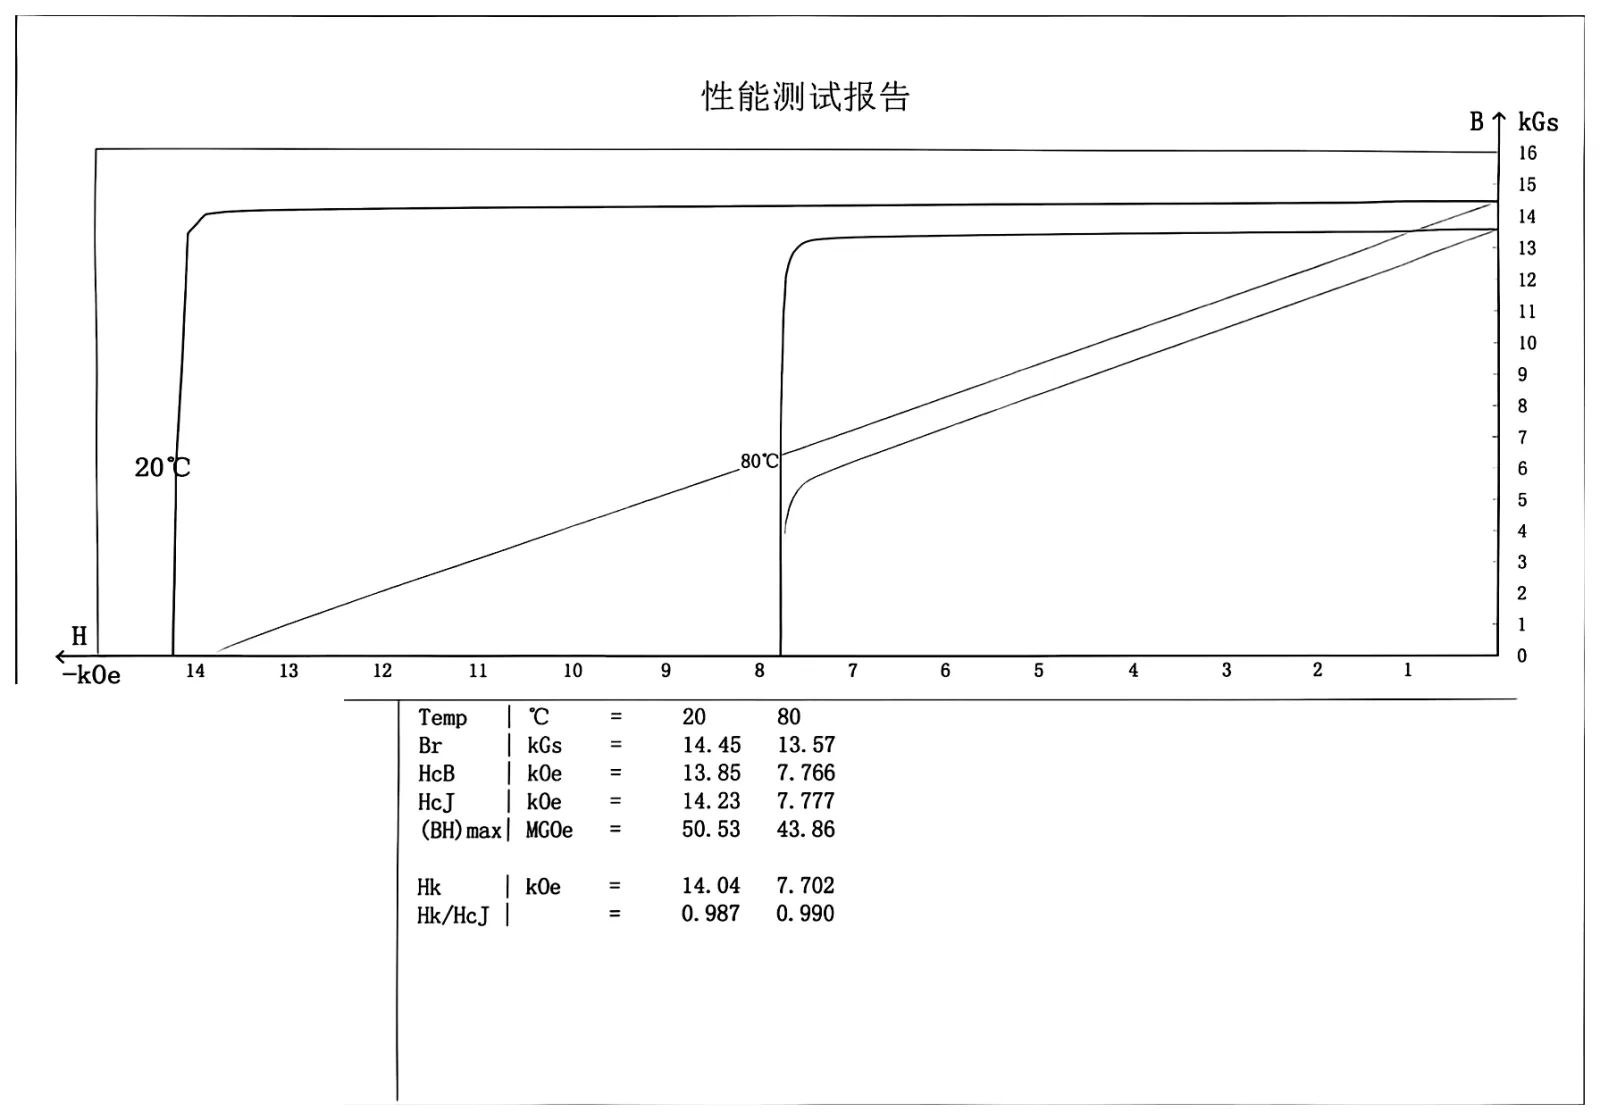
N52 sintered NdFeB demagnetization curves at 20/80 °C (measured)
| Temp. (°C) | Br (kGs) | HcJ (kOe) | (BH)max (MGOe) |
|---|---|---|---|
| 20 | 14.45 | 14.23 | 50.53 |
| 80 | 13.57 | 7.777 | 43.86 |
Average coefficients 20–80 °C: α(Br) -0.101 %/°C, β(HcJ) -0.756 %/°C.
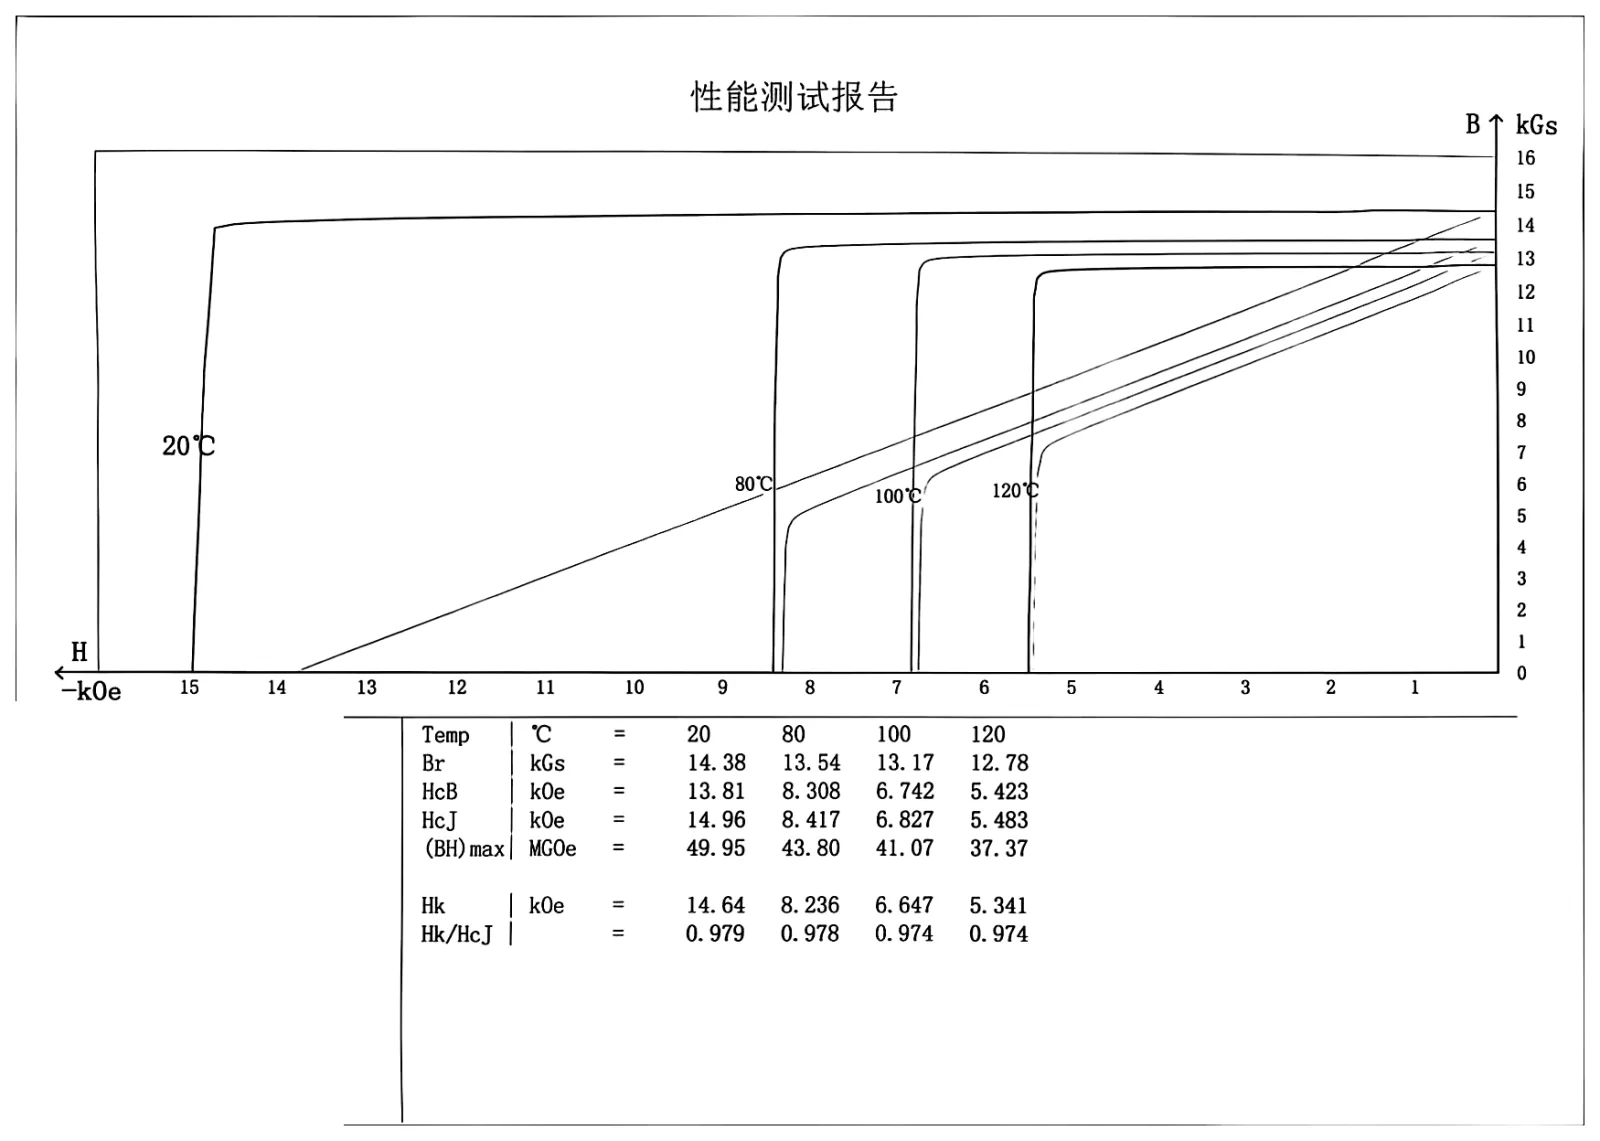
52M sintered NdFeB demagnetization curves at 20/80/100/120 °C (measured)
| Temp. (°C) | Br (kGs) | HcJ (kOe) | (BH)max (MGOe) |
|---|---|---|---|
| 20 | 14.38 | 14.96 | 49.95 |
| 80 | 13.54 | 8.417 | 43.8 |
| 100 | 13.17 | 6.827 | 41.07 |
| 120 | 12.78 | 5.483 | 37.37 |
Average coefficients 20–120 °C: α(Br) -0.111 %/°C, β(HcJ) -0.633 %/°C.
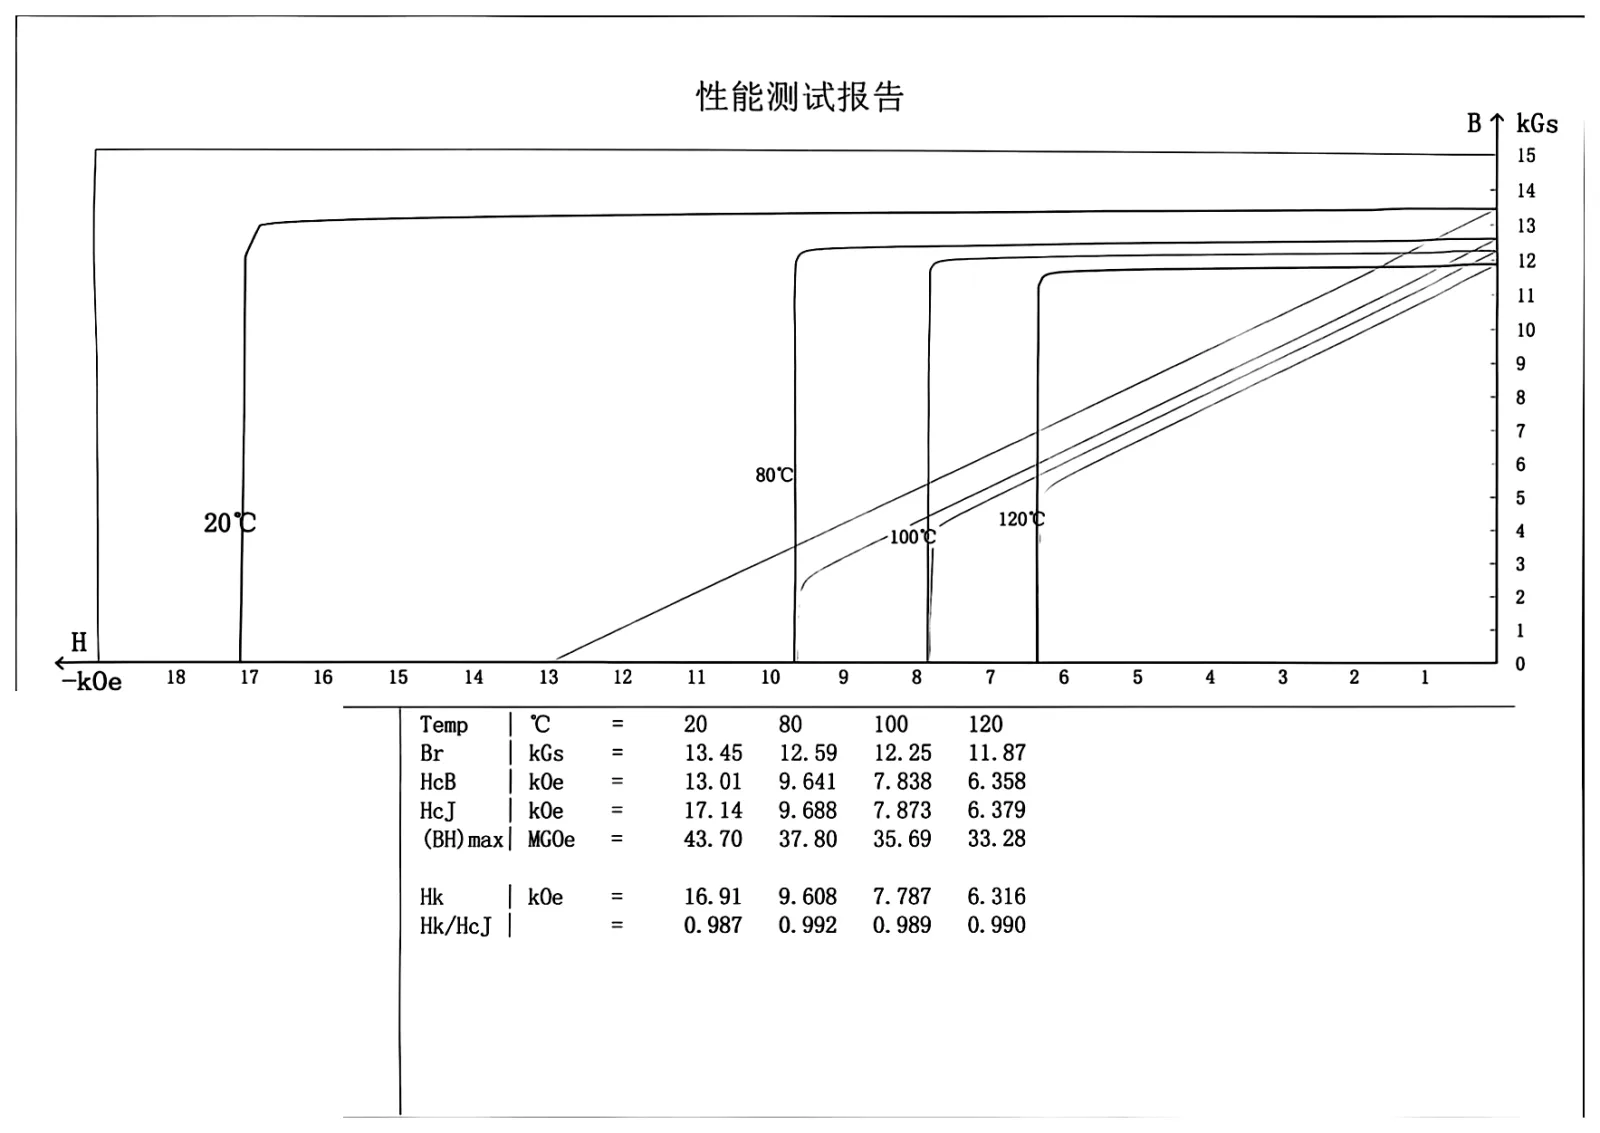
45H sintered NdFeB demagnetization curves at 20/80/100/120 °C (measured)
| Temp. (°C) | Br (kGs) | HcJ (kOe) | (BH)max (MGOe) |
|---|---|---|---|
| 20 | 13.45 | 17.14 | 43.7 |
| 80 | 12.59 | 9.688 | 37.8 |
| 100 | 12.25 | 7.873 | 35.69 |
| 120 | 11.87 | 6.379 | 33.28 |
Average coefficients 20–120 °C: α(Br) -0.117 %/°C, β(HcJ) -0.628 %/°C.
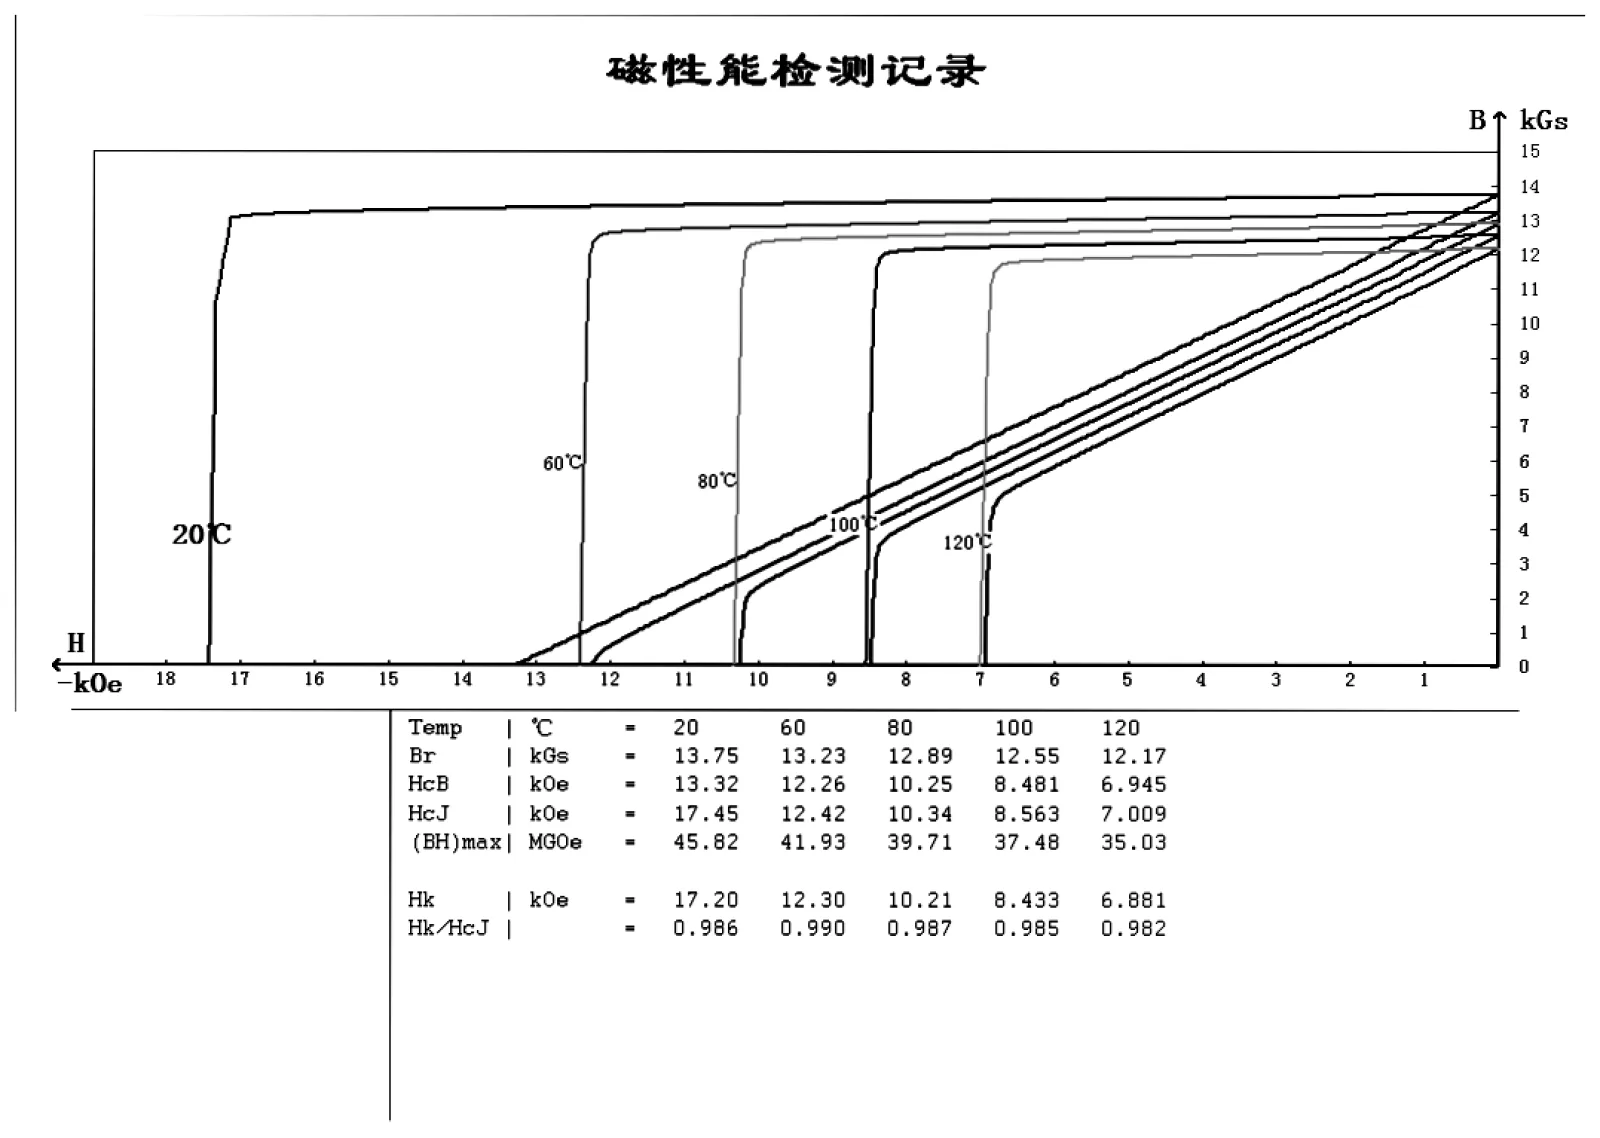
48H sintered NdFeB demagnetization curves at 20/60/80/100/120 °C (measured)
| Temp. (°C) | Br (kGs) | HcJ (kOe) | (BH)max (MGOe) |
|---|---|---|---|
| 20 | 13.75 | 17.45 | 45.82 |
| 60 | 13.23 | 12.42 | 41.93 |
| 80 | 12.89 | 10.34 | 39.71 |
| 100 | 12.55 | 8.563 | 37.48 |
| 120 | 12.17 | 7.009 | 35.03 |
Average coefficients 20–120 °C: α(Br) -0.115 %/°C, β(HcJ) -0.598 %/°C.
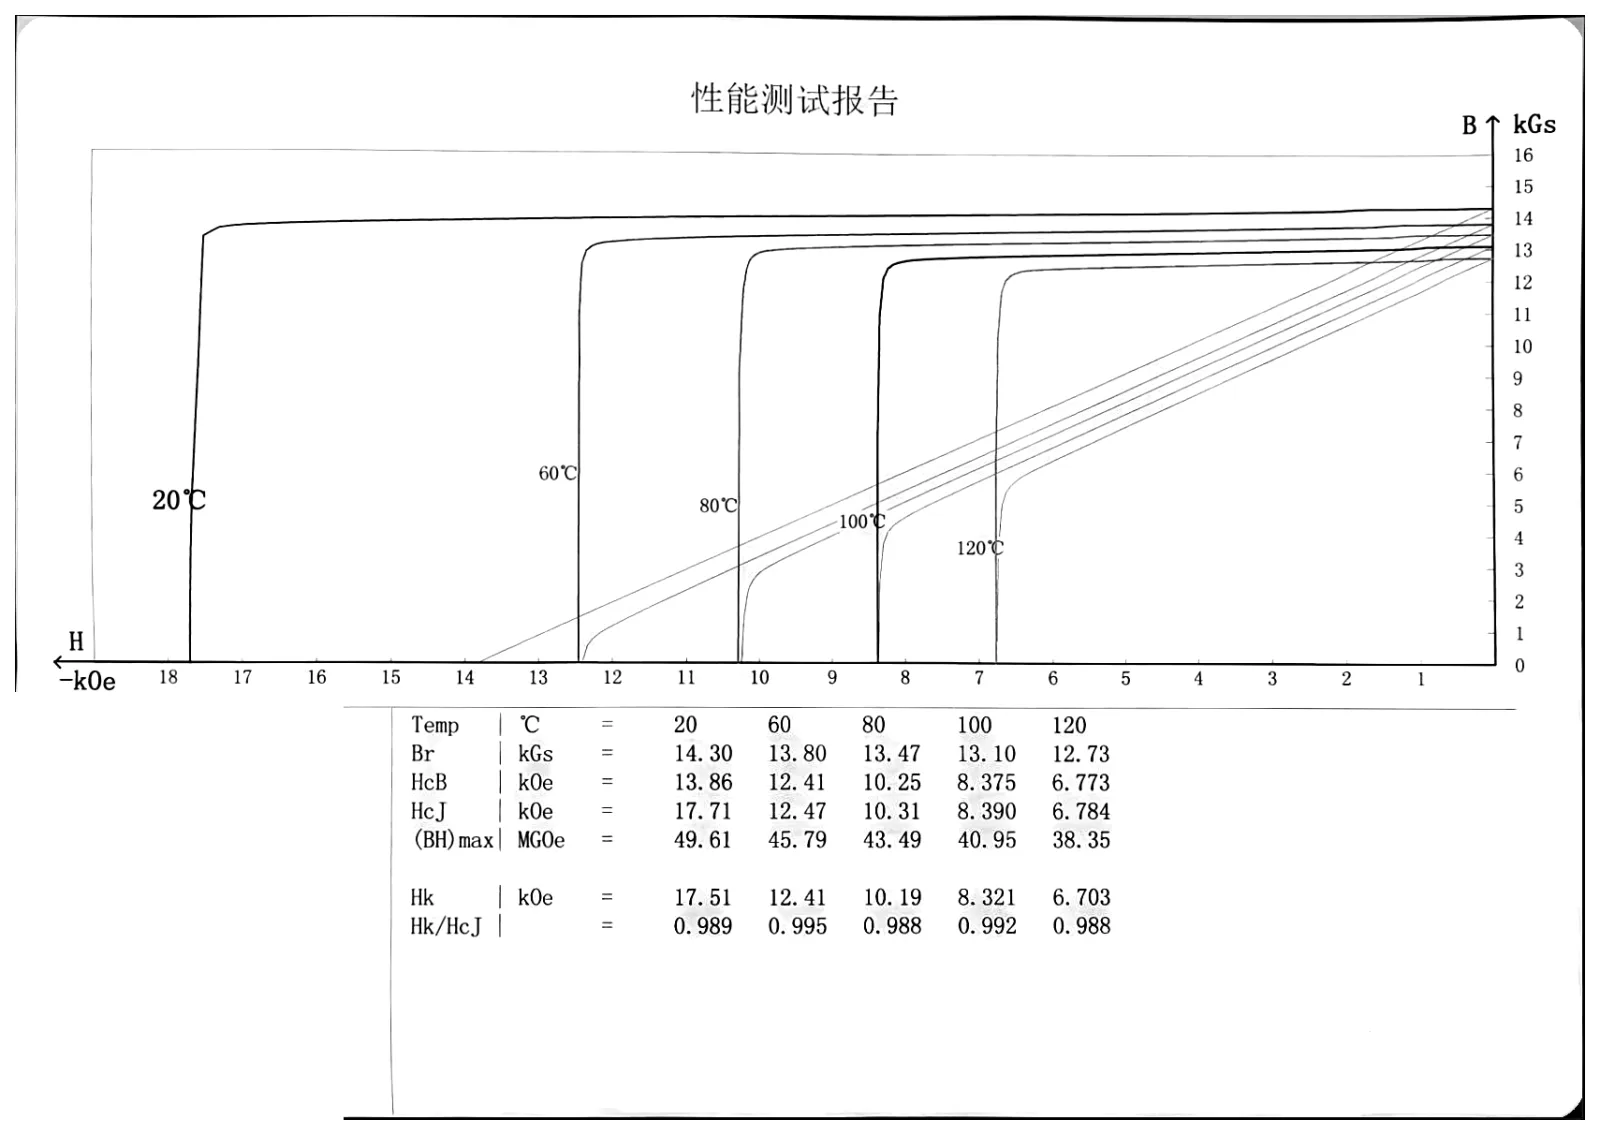
52H sintered NdFeB demagnetization curves at 20/60/80/100/120 °C (measured)
| Temp. (°C) | Br (kGs) | HcJ (kOe) | (BH)max (MGOe) |
|---|---|---|---|
| 20 | 14.3 | 17.71 | 49.61 |
| 60 | 13.8 | 12.47 | 45.79 |
| 80 | 13.47 | 10.31 | 43.49 |
| 100 | 13.1 | 8.39 | 40.95 |
| 120 | 12.73 | 6.784 | 38.35 |
Average coefficients 20–120 °C: α(Br) -0.110 %/°C, β(HcJ) -0.617 %/°C.
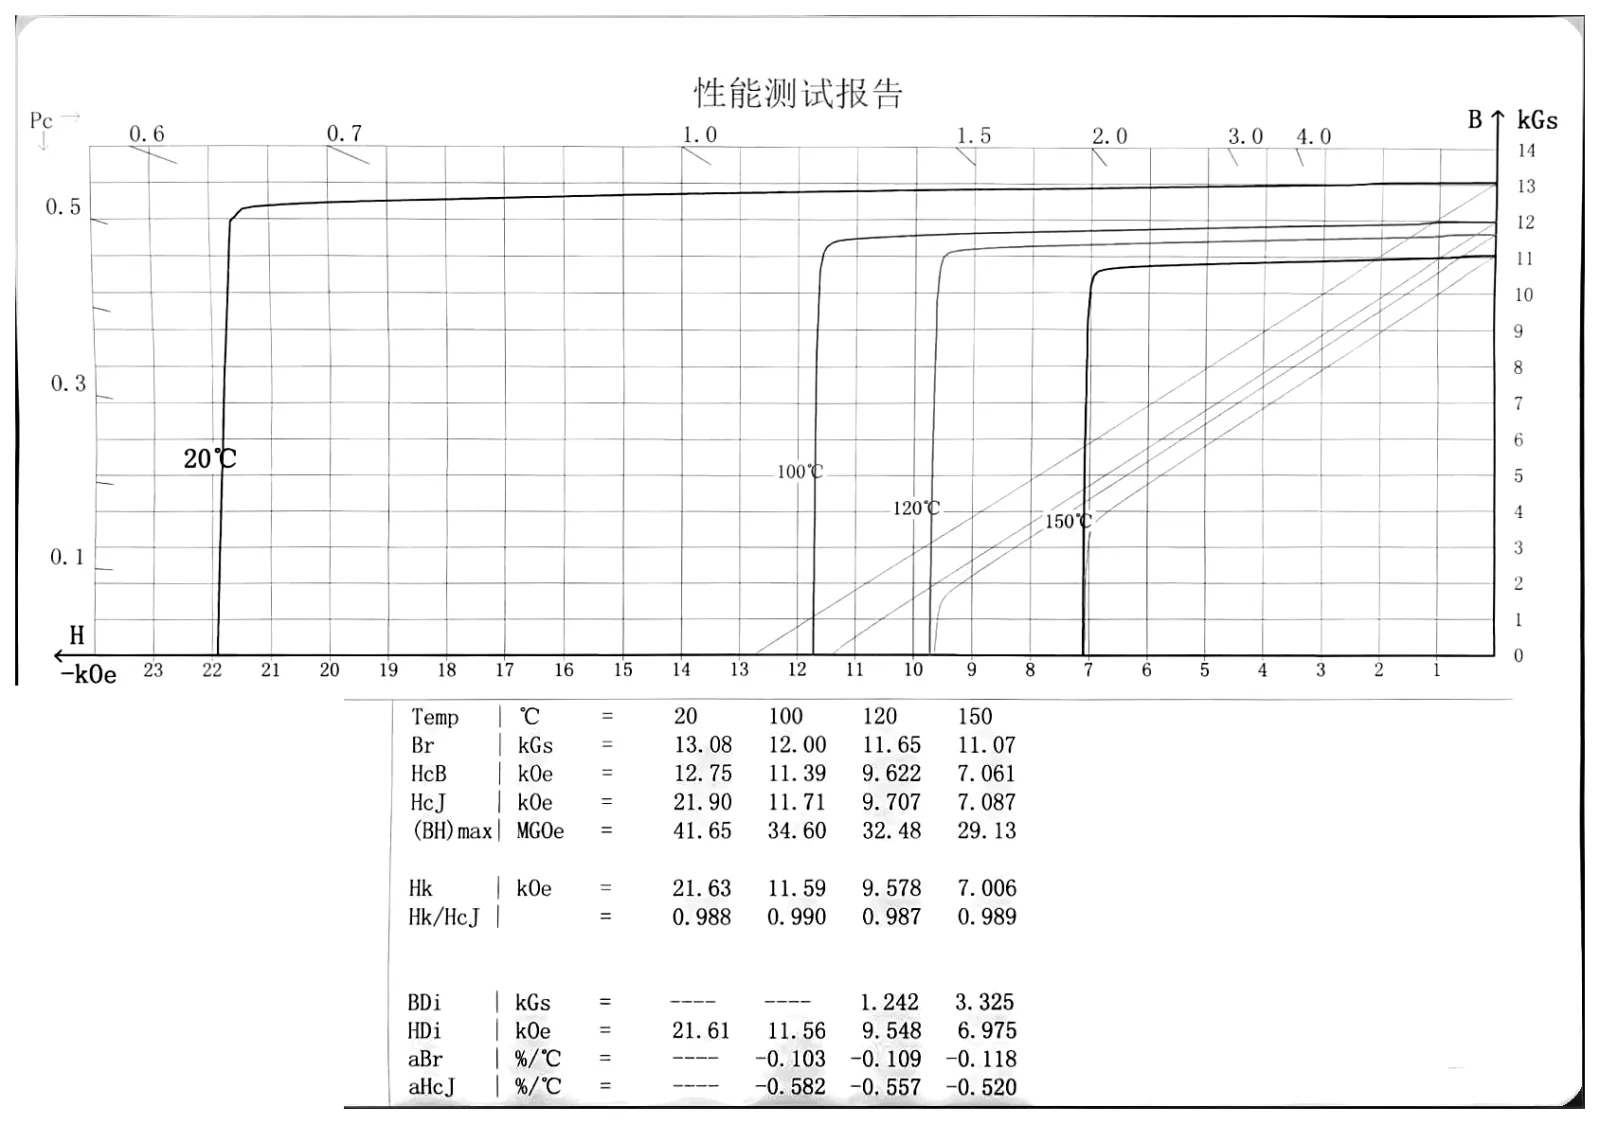
42SH sintered NdFeB demagnetization curves at 20/100/120/150 °C (measured)
| Temp. (°C) | Br (kGs) | HcJ (kOe) | (BH)max (MGOe) |
|---|---|---|---|
| 20 | 13.08 | 21.9 | 41.65 |
| 100 | 12 | 11.71 | 34.6 |
| 120 | 11.65 | 9.707 | 32.48 |
| 150 | 11.07 | 7.087 | 29.13 |
Average coefficients 20–150 °C: α(Br) -0.118 %/°C, β(HcJ) -0.520 %/°C.
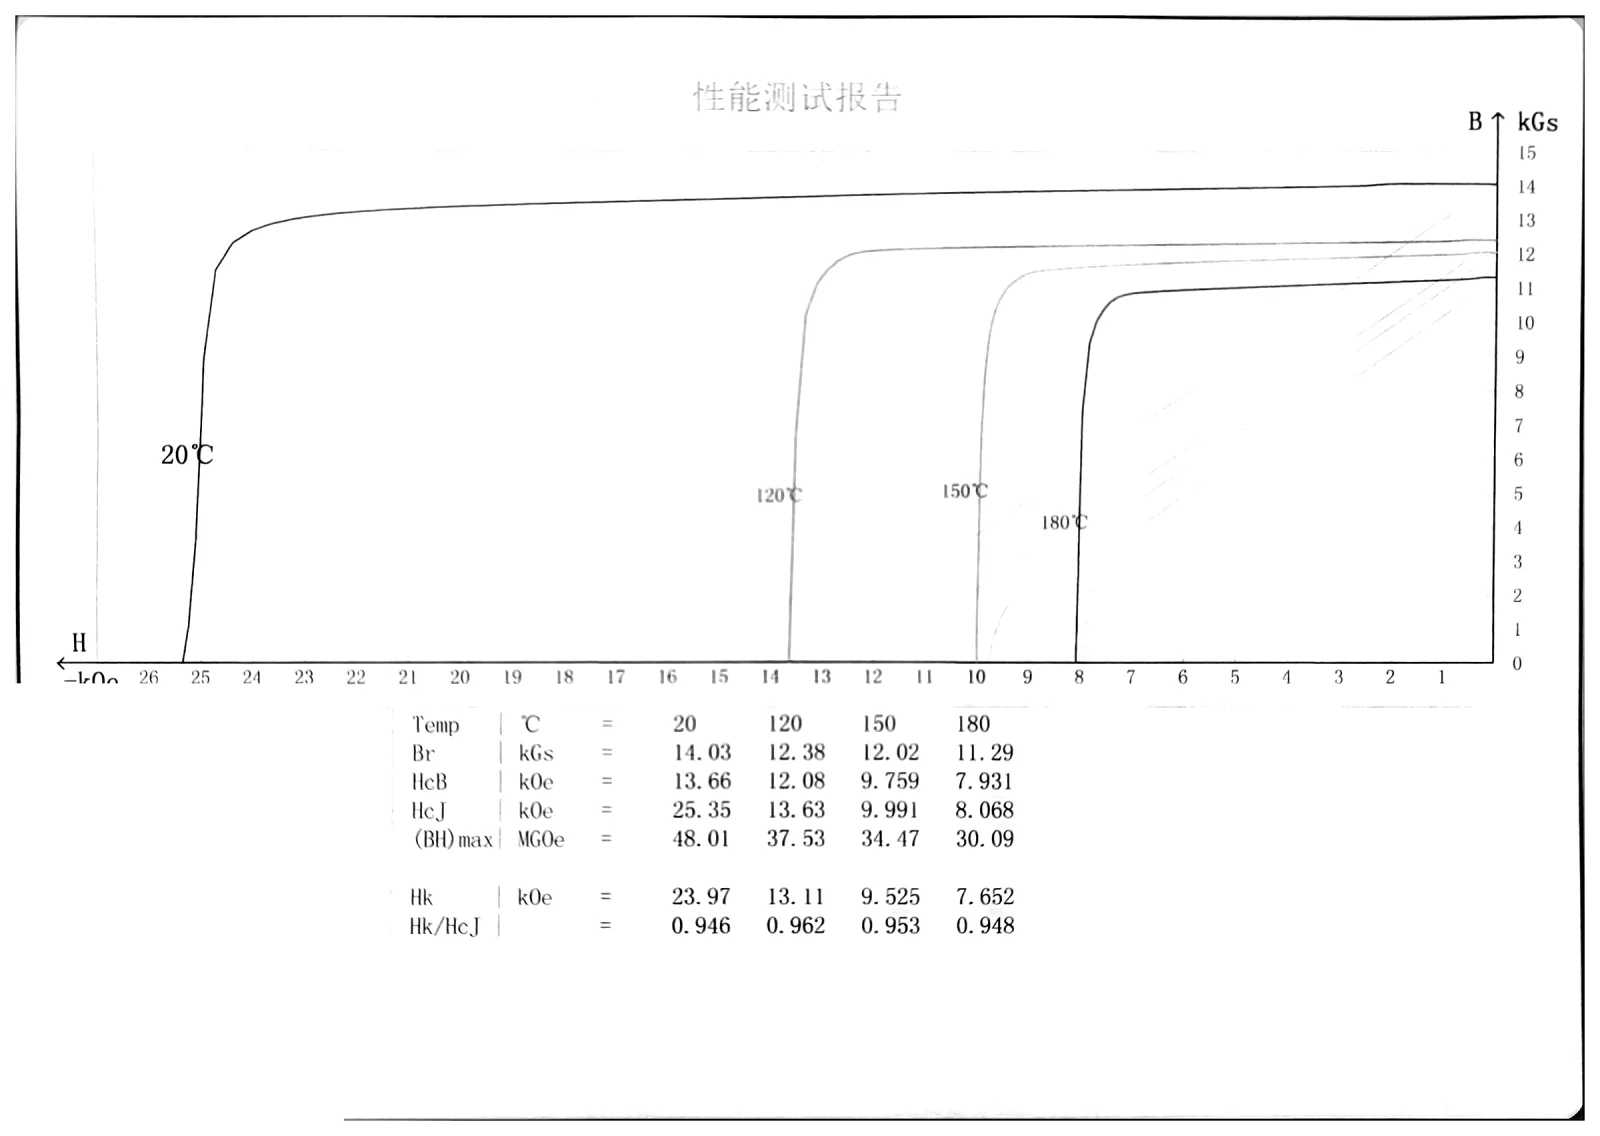
48UH sintered NdFeB demagnetization curves at 20/120/150/180 °C (measured)
| Temp. (°C) | Br (kGs) | HcJ (kOe) | (BH)max (MGOe) |
|---|---|---|---|
| 20 | 14.03 | 25.35 | 48.01 |
| 120 | 12.38 | 13.63 | 37.53 |
| 150 | 12.02 | 9.991 | 34.47 |
| 180 | 11.29 | 8.068 | 30.09 |
Average coefficients 20–180 °C: α(Br) -0.122 %/°C, β(HcJ) -0.426 %/°C.
Questions about these curves
What is the measured Br and HcJ of N52 sintered NdFeB?
An AIC N52 production lot measured at 20 °C gave Br 1.451 T (14.51 kGs), HcJ 1111 kA/m (13.96 kOe) and (BH)max 390.6 kJ/m³ (49.08 MGOe), with squareness Hk/HcJ 0.988. At 80 °C a different N52 sample (variable-temperature test) kept Br 13.57 kGs but HcJ dropped to 7.78 kOe.
How much does sintered NdFeB lose at high temperature?
In AIC's variable-temperature tests Br fell about 0.10–0.12 %/°C (0.101–0.122 across these samples) and HcJ about 0.4–0.8 %/°C. For example 52H went from 14.30 kGs / 17.71 kOe at 20 °C to 12.73 kGs / 6.78 kOe at 120 °C, and 48UH from 14.03 kGs / 25.35 kOe at 20 °C to 11.29 kGs / 8.07 kOe at 180 °C.
Which grade suffix should I choose for a motor running at 150 °C?
As a selection guide, start with the SH series (graded at HcJ of about 1592 kA/m, 20 kOe, and above at 20 °C); AIC's 42SH sample still had HcJ 7.09 kOe at 150 °C. If the magnet is thin or sees strong reverse field, step up to UH. Send us the operating point and we will check it against the curve.
Are these values guaranteed?
No. Each curve is one production lot's test result. The grade table on the sintered NdFeB product page gives typical values; specification limits are agreed per order, and the test report of your own lot is available on request.
Need the curve for your lot or temperature?
We can supply the hysteresisgraph report for your lot and measure at your working temperature.